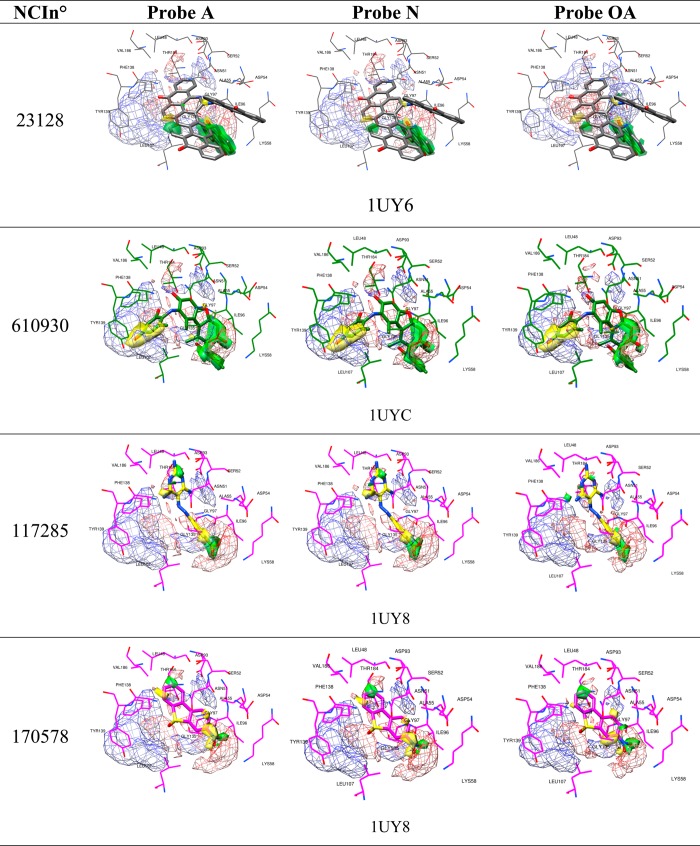
Figure 2.
Predicted activity contribution plots (solid: 75%, positive: green, negative: yellow), overlapped with PLS-coefficients plots (mesh: 65%, positive: red, negative: blue) obtained from the used 3-D QSAR models at the selected PC,5 for the most active screened compounds in their BC system (protein and pose): NCI23128 in 1UY6, NCI610930 in 1UYC, NCI117285 and NCI170578 in 1UY8.

