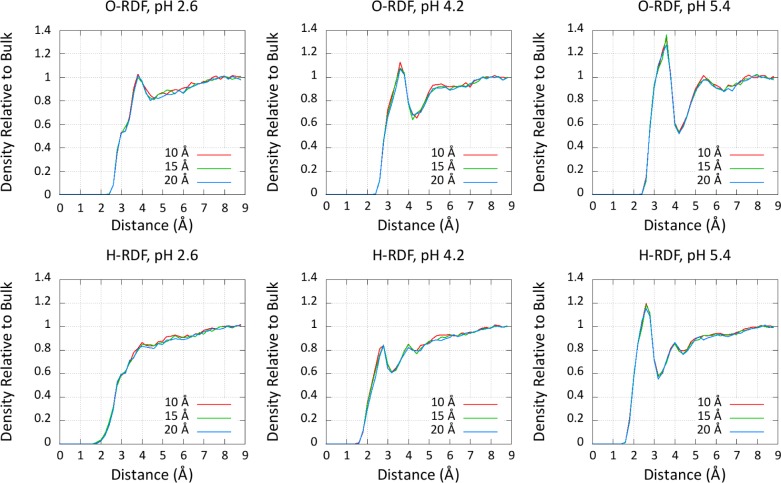
Figure 4.
Radial distribution functions (RDFs) of solvent oxygen atoms (O) and hydrogen atoms (H) with different unit cell sizes. The shown measurements—10, 15, and 20 Å—represent the size of the solvent buffer surrounding the solute. RDF plots for three different pHs are shown, highlighting the pH dependence of the solvent structure around the carboxylate of the aspartate model compound and its invariance to box size.

