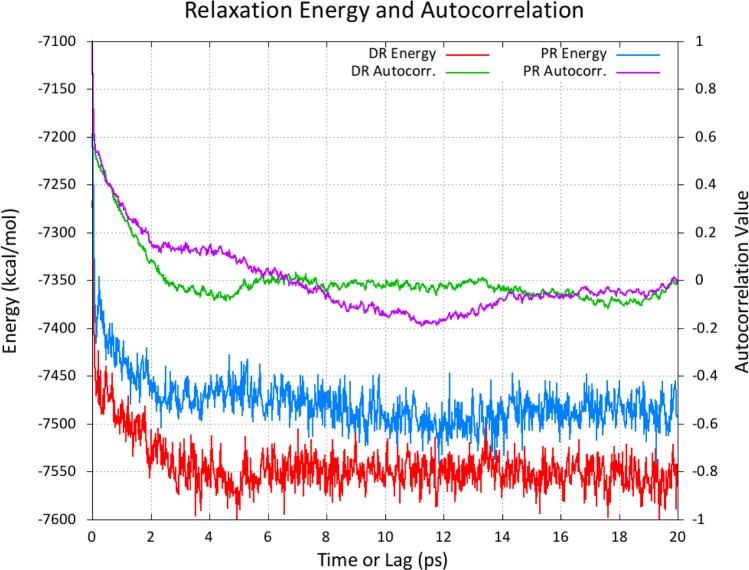
Figure 5.
The relaxation of the protonated state, starting from the protonated trajectory, is shown in blue with its autocorrelation function shown in purple. The relaxation of the deprotonated state from an equilibrated snapshot from the protonated ensemble is shown in red with its autocorrelation function shown in green. Here, PR and DR stand for Protonated-Relaxation and Deprotonated-Relaxation, respectively.

