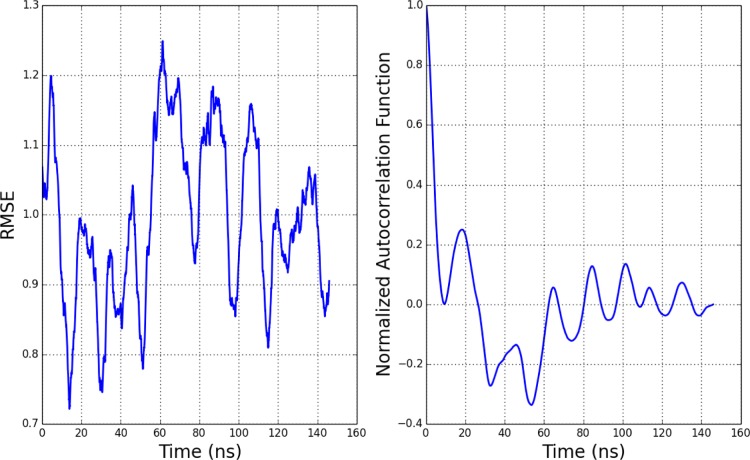
Figure 9.
(left) Plot showing the RMSE of all acidic titratable residue pKa values compared to experiment49 during the course of the simulation. A 5 ns window was used for the running average of the computed pKa. (right) Plot showing the autocorrelation function of the RMSE time series, showing that the correlation time between statistically independent samples is roughly 25 ns.

