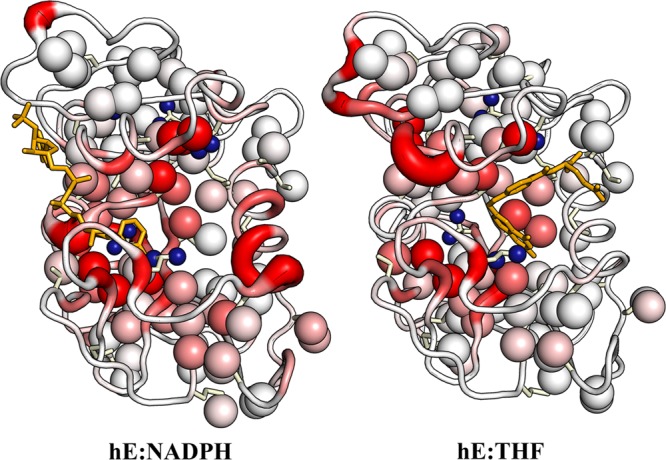
Figure 3.

Backbone and methyl side chain chemical shift differences between the binary complexes (hE:NADPH, left; hE:THF, right) and the ternary hE:FOL:NADP+ complex. The backbone color and ribbon diameter report on the average amide and Cα chemical shift differences: ΔδNHC = [ΔδH2 + (ΔδN/5)2 + (2ΔδCα/5)2]1/2. The backbone is colored by a gradient from white, indicating minimal chemical shift difference, to red for ΔδNHC values of >1.0 ppm. Ile, Thr, Val, and Leu side chains are shown as sticks, with the methyl groups shown as spheres. The methyl groups are colored with a white to red gradient according to the average methyl chemical shift difference: ΔδCH3 = [ΔδHmethyl2 + (ΔδCmethyl/3)2]1/2, where red indicates a ΔδCH3 of >0.4 ppm. Leu residues with unassigned or ambiguous methyl chemical shifts are shown as small blue spheres.
