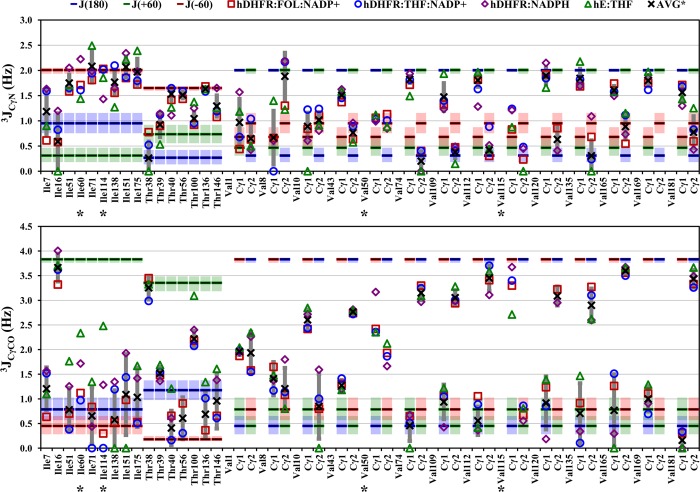
Figure 4.
3JCγN and 3JCγCO values for Ile, Thr, and Val residues of the hE:FOL:NADP+ (squares), hE:THF:NADP+ (circles), hE:NADPH (diamonds), and hE:THF (triangles) complexes. Blue, green, and red bars show the expected 3J values for fully populated 180°, 60°, and −60° χ1 rotamers, respectively; shaded areas represent the variation in 3J values over a ±5° span about the staggered rotamer, according to the relevant Karplus curves (Figure S1 of the Supporting Information). The average coupling over all complexes is shown as an X, except for residues with different rotamer populations in one or more complexes, which are labeled with an asterisk. Complexes are excluded from the average if the error in the coupling constant is >1 Hz. The standard deviation of 3Javg is shown as a dark gray vertical bar.

