
Figure 3.
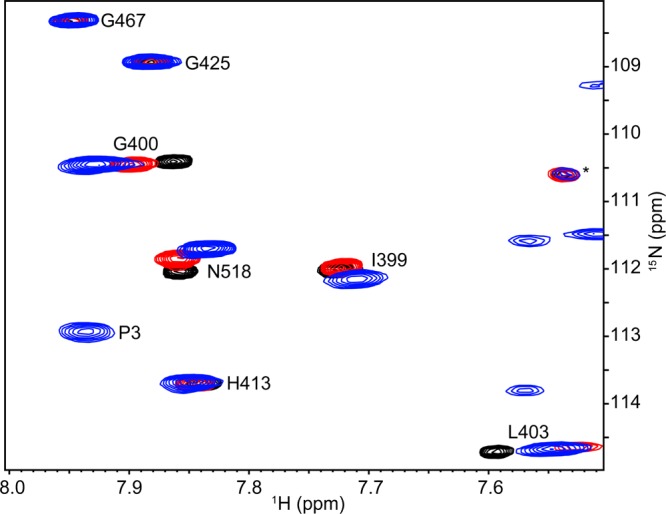
Differences in P4 amide NMR resonances in three constructs. Shown is a representative region of the 1H–15N TROSY-HSQC spectrum of P3P4 (blue) superimposed with the spectra of P4 (black) and P4l (red).
Official websites use .gov
A
.gov website belongs to an official
government organization in the United States.
Secure .gov websites use HTTPS
A lock (
) or https:// means you've safely
connected to the .gov website. Share sensitive
information only on official, secure websites.
Differences in P4 amide NMR resonances in three constructs. Shown is a representative region of the 1H–15N TROSY-HSQC spectrum of P3P4 (blue) superimposed with the spectra of P4 (black) and P4l (red).