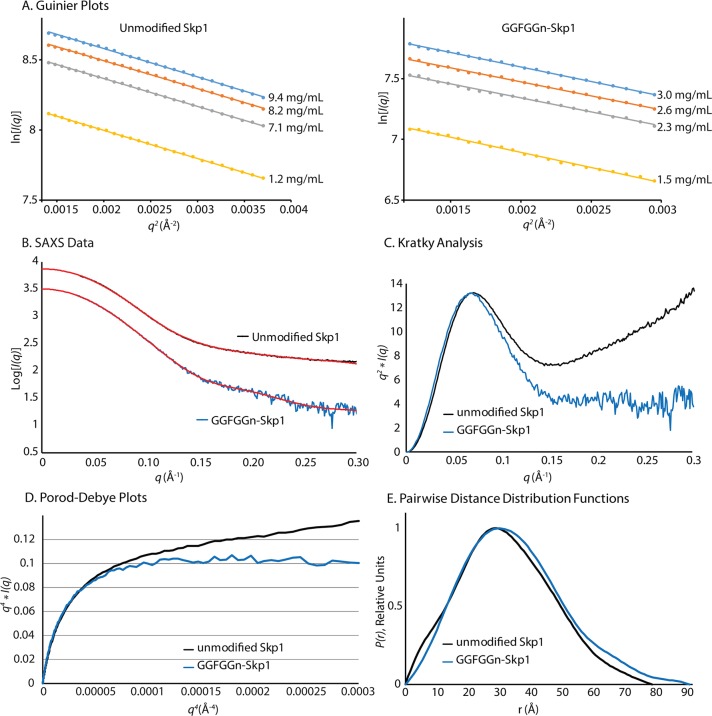
Figure 4.
SAXS analysis of Skp1 and GGFGGn-Skp1. Skp1 and GGFGGn-Skp1 were analyzed at concentrations of 60–460 μM in SAXS buffer. (A) Guinier analysis at different Skp1 concentrations, where q = 4π sin θ/λ (2θ is the scattering angle and λ the X-ray wavelength). (B) Scattering intensity plots averaged from the concentrations shown in panel A, for unmodified Skp1 (black) and GGFGGn-Skp1 (blue). Fourier transformations of the scattering data are shown as the P(r) functions in panel E; the red traces represent the inverse Fourier transformations of the P(r) functions. (C) Kratky plots of Skp1 were generated from the averaged data shown in panel B. (D) Porod–Debye representation of the data shown in panel B. (E) Pairwise distance distribution functions of the averaged data.

