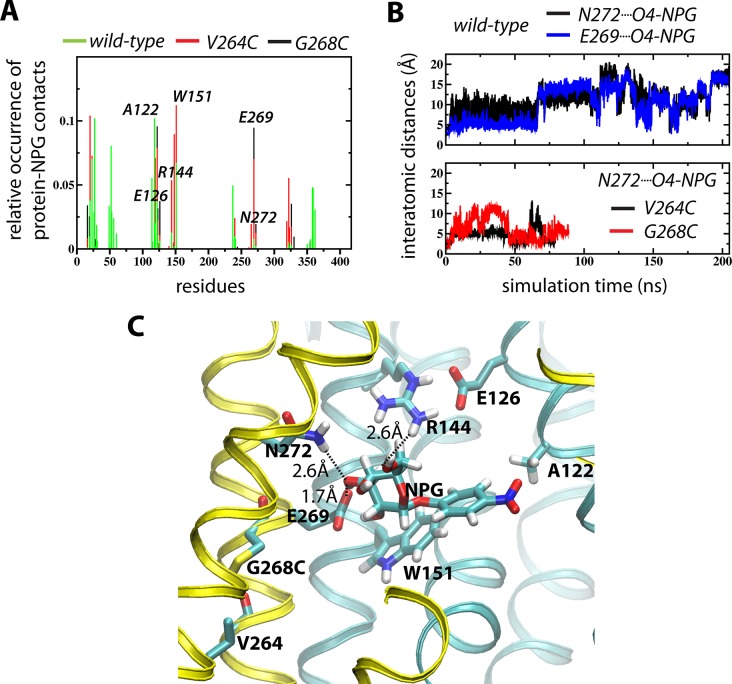
Figure 2.
MD simulations of NPG binding. (A) Contact analyses of the WT (green), G268C (black), and V264C (red) simulations reporting <3.5 Å protein–NPG interactions. (B) Evolution of the interatomic distances between NPG O4 and N272 NH (black) and E269 O (blue) for the WT (top) and the NPG O4···N272 NH distances for the G268C (red) and V264C (black) simulations. (C) NPG binding pose displayed by the final frame of the G268C simulation.

