
Figure 4.
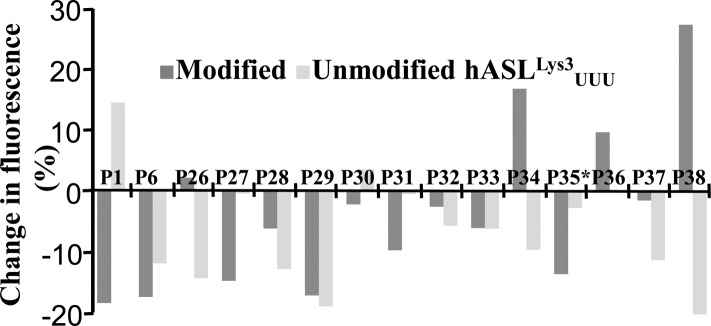
Fluorescence of chemically synthesized peptides effected by modified and unmodified hASLLys3UUU. An initial fluorescent signal (FS0) of peptide alone (1.5 μM) was obtained. Then, a 2-fold excess of ASL was added to each peptide, and the fluorescent signal (FS1) was monitored. The percent change (100·(FS1/FS0)) is graphed for each of the assayed peptides. Dark gray bars represent the percent change in fluorescence in the presence of the modified hASLLys3UUU, and light gray bars represent the percent change in the presence of the unmodified hASLLys3UUU. Sequences for P1–P38 are presented in Table 3