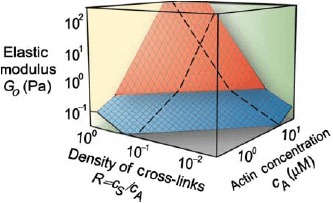
Figure. 10.

State diagram showing variations of elasticity due to changes of the actin concentration or changes of the cross-linker density (cs represents the concentration of the cross-linker scruin). By varying these factors, the elastic modulus can be varied by more than three orders of magnitude. The elasticity can be distinguished in two different regimes: a linear regime arises for small values of R and cA up to large strains without any stiffening effects (blue plane). A nonlinear regime arises for large values of R and cA even under small deformations (red plane). The elasticity increases under increasing strain. Reprint from Gardel et al. [14] with permission from AAAS.
