Figure 21.

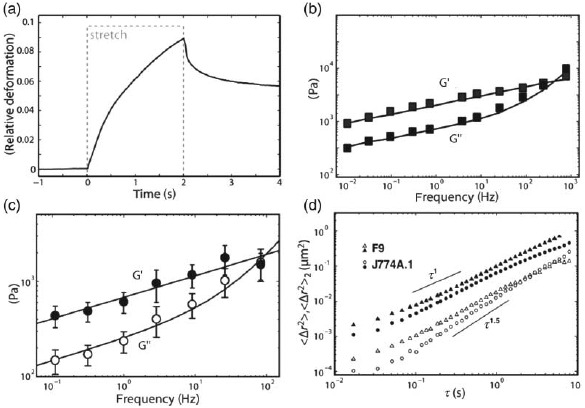
Characteristic measurement curves for four selected rheological techniques as an example for active probing methods on suspended (a), adherent (b, c) and for a passive method on adherent cells (d). (a) Example graph of a step-stress compliance experiment with the optical stretcher. Cells are held at trap power for 1 s, then stretched with 1.2 W for 2 s and subsequently monitored at trap power for another 2 s. Shown here is the relative deformation of cells along the laser axis over time. This graph is an average of 167 cells. (b) Shear moduli extracted from magnetic twisting rheology plotted versus twisting frequency [243]. (c) Frequency dependence of the storage modulus G′ (filled symbols) and the loss modulus G″ (open symbols) measured on A549 cells (N = 12) at different oscillation frequencies using an SFM [238]. (d) Mean square displacement of a single particle (solid symbols) and two particles (open symbols). With the two particles method superdiffusive behavior is found [256]. Data were reproduced with permission from Ben Fabry (b), Jordi Alcaraz (c), and Tom Lubensky (d).
