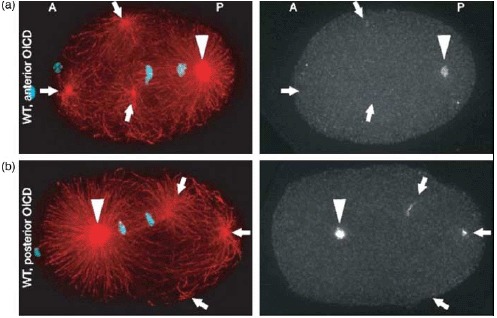
Figure. 26.

(a) Anterior and (b) posterior optically induced centrosome disintegration. MTs asters were visualized by indirect immune-fluorescence to tubulin (red) in the left panels and γ-tubulin in the right panels. DNA is stained blue. Arrows point to aster fragments, arrowheads to unirradiated centrosomes. Reprint from Grill et al. [315] with permission from AAAS.
