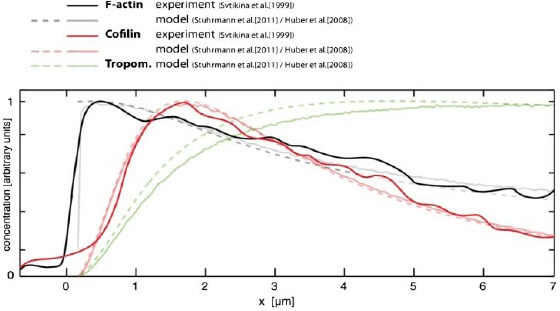
Figure. 33.

Comparison of experimental data from migrating keratocytes (taken from [387] with theoretical result obtained from computer simulation (taken from [180]) and mathematical modeling (taken from [179]). The depicted curves show concentration profiles of F-actin as well as cofilin and tropomyosin along the lamellipodial network starting at the leading edge (x = 0). For both F-actin and cofilin, theory and experiments are in good agreement.
