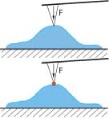
Table 1.
Schematic representation of different methods to characterize cellular viscoelastic behavior.
| Technique | Range of application | References |
|---|---|---|
Micropipette aspiration
|
Local or global probing depending on diameter Time range 1–1000 s |
[235,236] |
SFM indentation
|
Low and high strains possible Local or averaged probing Frequency range 1–300 Hz Force range pN–nN Low and high strains possible |
[220,237,238] |
Active & passive optical-trap rheology
|
Probing of the overall force and fraction of that force transmitted to the environment | [239] |
| Passive bead rheology |
Passive method Local properties |
[240] [241,242] |
| Magnetic bead rheology |
Local probing Frequency range 10−2–103 Hz Torques up to 130 Pa linear |
[243,244] |
Optical stretcher
|
Local or global probing Stresses (Pa) Forces 10−10 N Small strains |
[225,233,245–247] |
