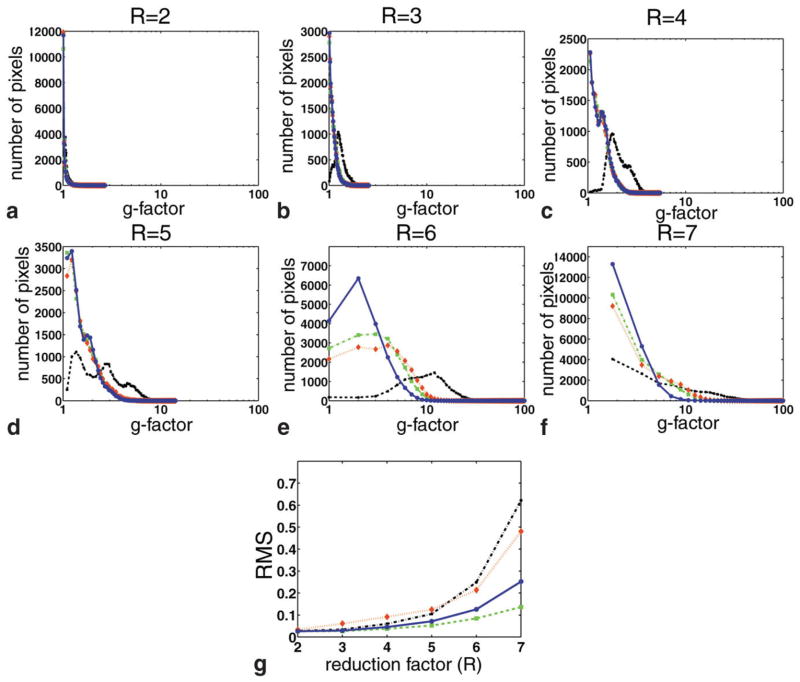
FIG. 3.
a–f: g-Factor histograms for SENSE (black line), phase-constrained SENSE (red line), turboSENSE with the fully-resolved phase (green line), and turboSENSE with iterative phase refinement (blue line) for different reduction factors (R = 2–7). The latter three have similar histograms and lower g-factors than SENSE. g: RMS measurements as a function of reduction factor.

