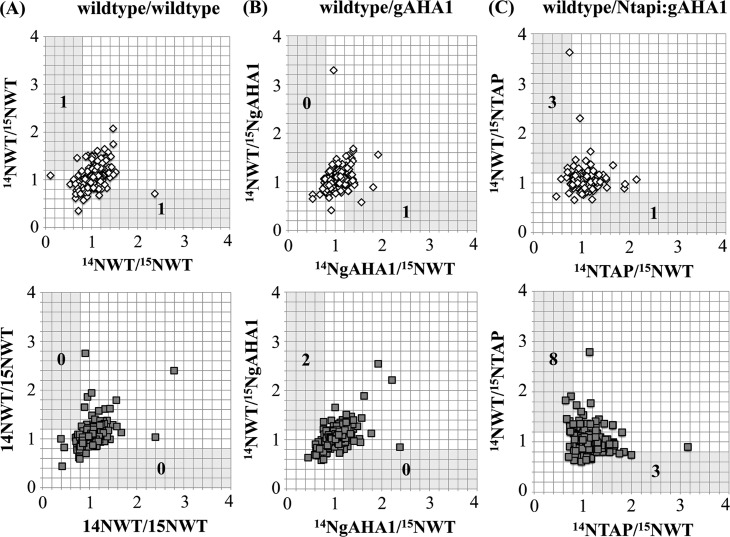
Figure 5.
Reciprocal soluble protein ratios in metabolically labeled tissue pairs. Wild-type (WT), wild-type AHA1-rescued (gAHA1), and Ntapi:gAHA1-rescued plants were grown in natural-abudance (14N) and heavy isotope (15N) nitrogen media. Equal fresh weights of (A) wild-type/wild-type, (B) wild-type/gAHA1, and (C) wild-type/Ntapi:gAHA1 genotype pairs from two biologically replicated experiments (upper and lower plots) were mixed prior to homogenization, sample processing, and MS analysis. Protein ratios (14N/15N) were calculated by averaging median-normalized peptide ratios determined by Census, with a minimum MASCOT score of 30. Protein ratios for reciprocally labeled tissue pairs were plotted for proteins identified by two or more peptides in both samples. The number of proteins showing reciprcal ratios of ≥1.2 and ≤0.8 in each sample are indicated.

