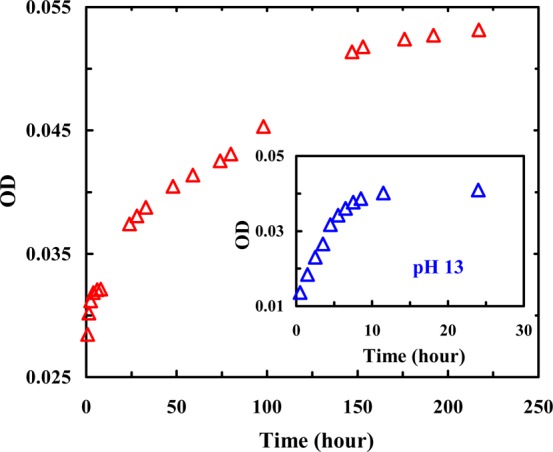
Figure 3.

Intensity of the 1616 cm–1 band of Trpzip1 (1.2 mM, pH 3) as a function of incubation time, showing the aggregation kinetics of this peptide at acidic pH. For comparison, the aggregation data of Trpzip1 (0.7 mM) obtained at pH 13 are shown in the inset. The corresponding FTIR spectra are presented in Figure S2 of the Supporting Information.
