
Figure 2.
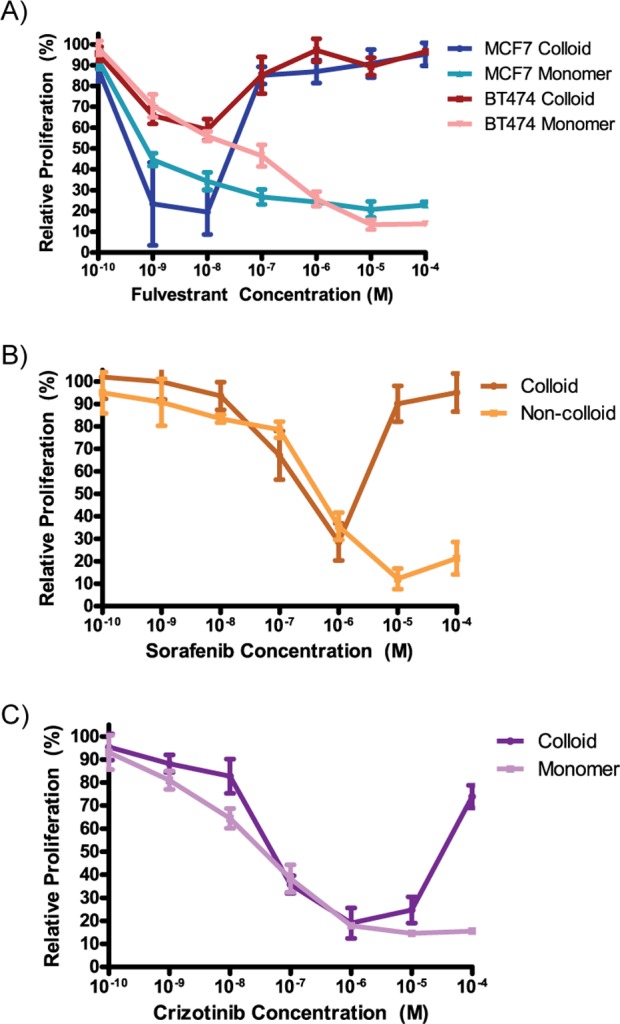
Concentration–response curves for colloidal formulations of anticancer drugs are U-shaped. (A) Fulvestrant was tested in two different cell lines: MCF-7 and BT-474. A distinct loss of activity is seen at concentrations ≥1 μM. (B) Sorafenib was tested in MDA-MB-231 cells and shows a loss of activity at concentrations ≥10 μM. (C) Crizotinib was tested in T47D cells and begins to lose antiproliferative activity at 10 μM (mean ± standard deviation; n = 6).