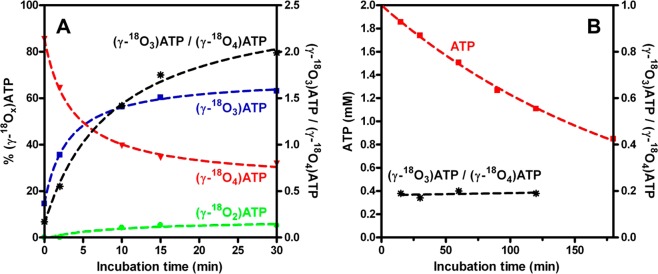
Figure 5.

Rates of positional isotope exchange or ATP hydrolysis. (A) P-gp supersomes. The fractions of the exchanging species γ-18O4-ATP in red, γ-18O3-ATP in blue, and γ-18O2-ATP in green as a function of the incubation time are shown. Also, the time dependence of the ratio γ-18O3-ATP/γ-18O4-ATP is presented (black line). (B) Purified liposome-reconstituted P-gp. The hydrolysis rate (red line) and the time dependence of the ratio γ-18O3-ATP/γ-18O4-ATP (black line) are shown. The reactions were conducted as described in the text, and 31P NMR spectra were recorded at the times indicated. ATP concentrations and the PIX rates were determined from the areas of the 31P NMR signals of the γ-phosphorus atom of ATP corresponding to the γ-18O4-ATP, γ-18O3-ATP, and γ-18O2-ATP moieties.
