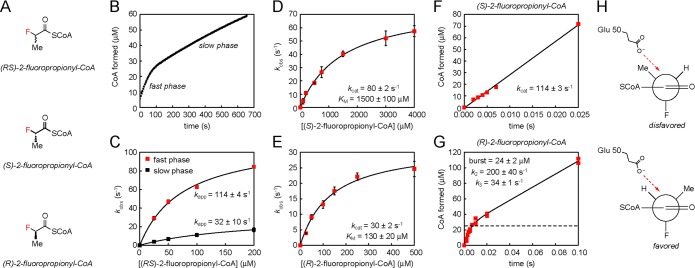
Figure 3.
Kinetic analysis of 2-fluoropropionyl-CoA hydrolysis. (A) 2-Fluoropropionyl-CoA stereoisomer structures. (B) Time course for hydrolysis of 100 μM (RS)-2-fluoropropionyl-CoA. (C) Observed rate constants (kobs) for the slow phases and fast phases plotted over a range of substrate concentrations. (D) Steady-state kinetic analysis of (S)-2-fluoropropionyl-CoA. Values are reported as means ± the standard deviation (n = 3). (E) Steady-state kinetic analysis of (R)-2-fluoropropionyl-CoA. Values are reported as means ± the standard deviation (n = 3). (F) Pre-steady-state kinetic analysis of FlK-catalyzed hydrolysis of (S)-2-fluoropropionyl-CoA. (G) Pre-steady-state kinetic analysis of FlK-catalyzed hydrolysis of (R)-2-fluoropropionyl-CoA. (H) Analysis of FlK acylation by 2-fluoropropionyl-CoA in terms of the Felkin–Ahn model. The steric and electronic preferences of the substrate in combination with the structural constraints of the enzyme may explain the defect in acylation rate for (S)-2-fluoropropionyl-CoA compared to (R)-2-fluoropropionyl-CoA.

