Figure 1.
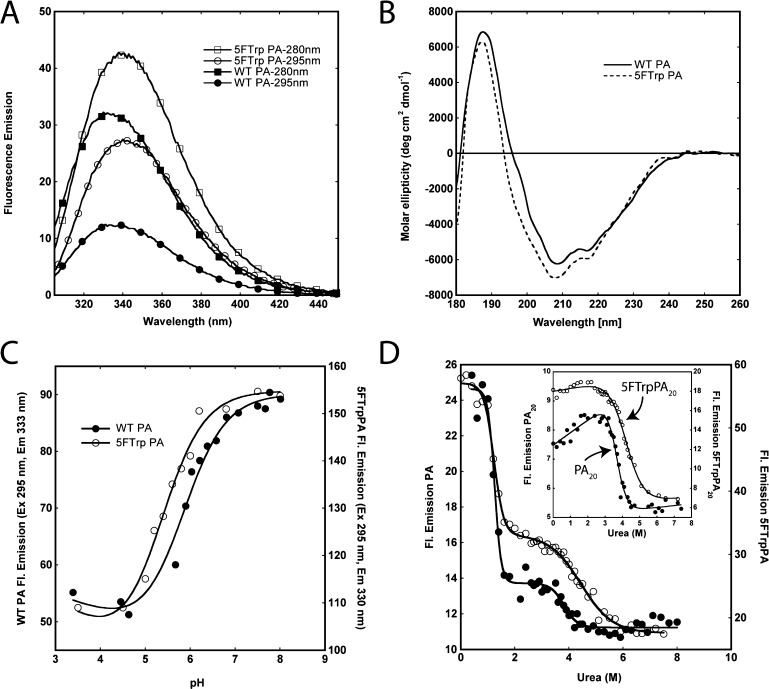
Effect of 5-FTrp labeling on the spectroscopic properties and stability to urea and pH of PA. (A) Emission spectra (excitation at 280 or 295 nm) of WT PA and 5-FTrpPA at 1 μM in 50 mM Tris/25 mM Mes/25 mM AcOH buffer (pH 8.0) at 20 °C. (B) Circular dichroism spectra of WT (―) and 5-FTrpPA (---) at 8 μM in 10 mM Hepes/OH (pH 8.0) at 20 °C. (C) Unfolding of WT and 5-FTrpPA as a function of pH at 0.8 μM in 50 mM Tris/25 mM Mes/25 mM AcOH buffer at 20 °C. Fluorescence data were acquired using an excitation wavelength of 295 nm, and solid lines through the data are fits to the Henderson–Hasselbalch equation. (D) Unfolding of WT (●) and 5-FTrpPA (○) as a function of urea concentration. The inset shows unfolding of PA20 and 5-FTrpPA20. Data were collected in 50 mM Tris/25 mM Mes/25 mM AcOH buffer (pH 8.0) at 20 °C, via excitation at 295 nm and collection of the emission intensity at 330 nm (unlabeled) and 333 nm (5-FTrp-labeled). The concentration of all proteins was 0.8 μM. Solid lines represent nonlinear least-squares fits to the data.

