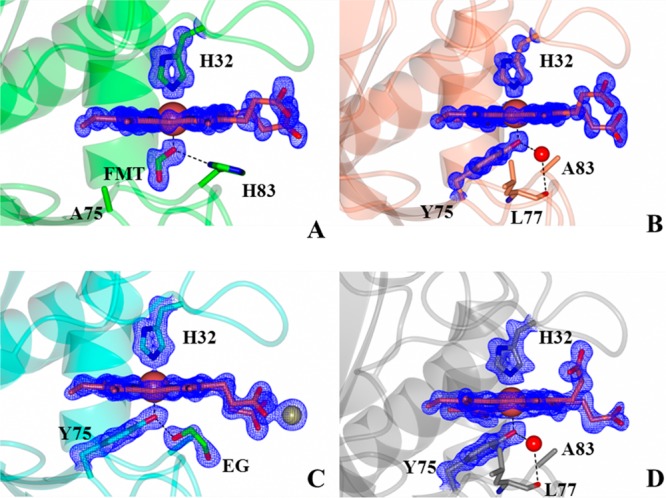
Figure 6.

Close-up views of the heme binding sites in (A) Y75A HasAp, (B) H83Aortho HasAp, (C) H83Amono HasAp, and (D) H83ApH5.4 HasAp. Fobs – Fcalc electron density omit maps contoured at 3σ are shown as blue mesh. FMT denotes the formate ion and EG ethylene glycol. The Zn2+ ion in panel C is shown as a sphere.
