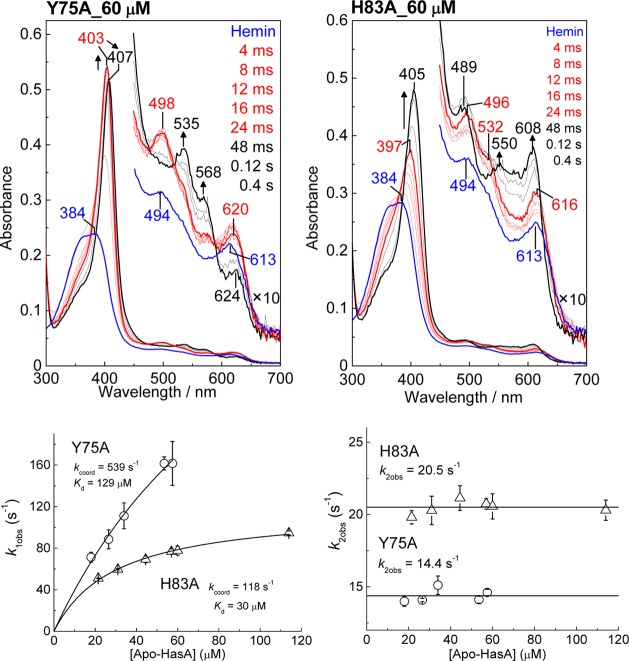
Figure 8.
Stopped-flow absorption spectra of the association of 4.7 μM hemin with (A) Y75A and (B) H83A apo-HasAp at 60 μM. Red and black traces are representative of early and late phases of the reaction, respectively; the blue traces are hemin/buffer controls. Also shown are plots of observed rate constants vs apo-HasAp concentration.

