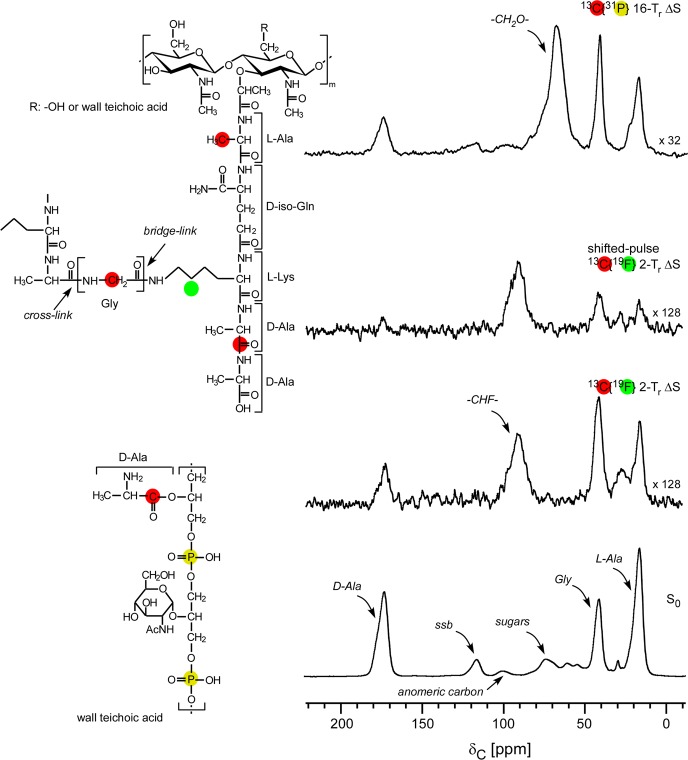
Figure 1.
C{F} and C{P} REDOR spectra of intact cell walls of the FemA mutant of S. aureus grown on media containing d-[1-13C]alanine, l-[3-13C]alanine, [2-13C]glycine, and l-[5-19F]lysine with the alanine racemase inhibitor, alaphosphin. The full-echo spectrum is at the bottom of the figure, and various REDOR differences are above. The shifted-pulse evolution time (second from top) was much less than two rotor periods. In this experiment, the separation of the two 19F π pulses was changed from the normal 140 μs (one rotor period) to 220 μs so that the effective recoupling time was only 30 μs per rotor period over the two rotor periods of REDOR dephasing. The inset shows the location of the labels (red, 13C; green, 19F) of peptidoglycan and (red, 13C; yellow, 31P) wall teichoic acid. All other carbons are at natural abundance. Spinning sidebands are designated by “ssb”.

