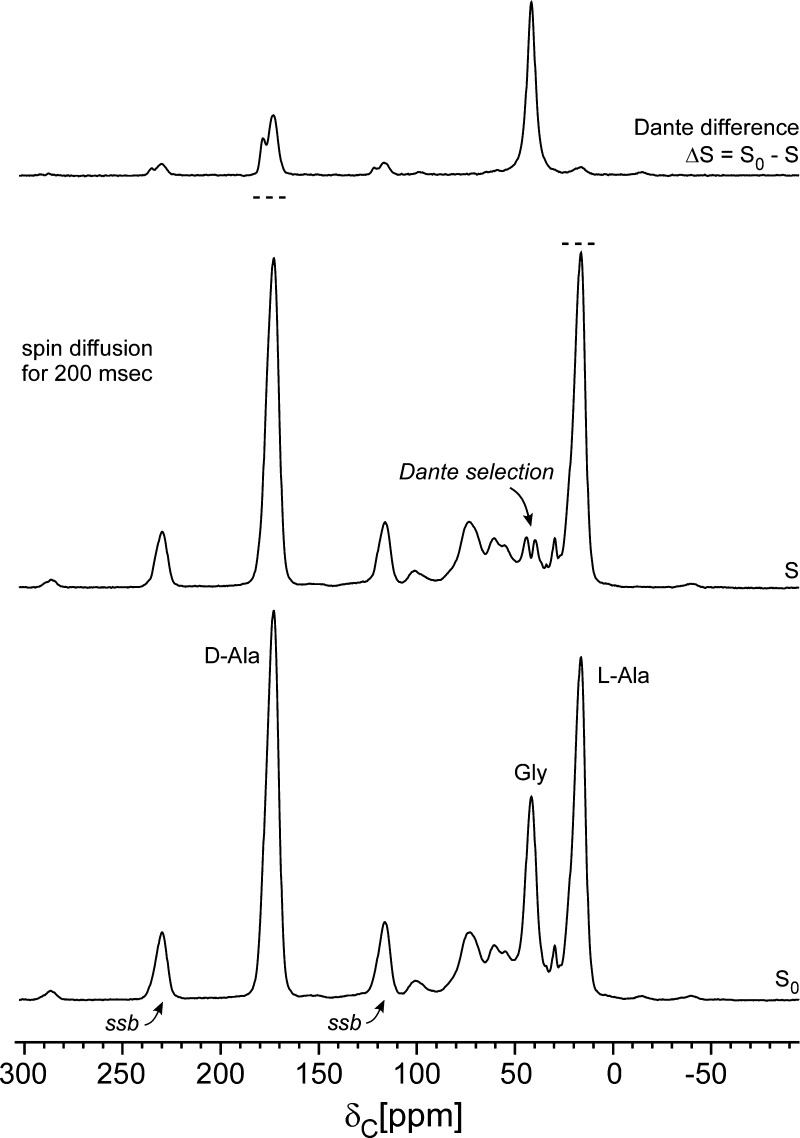
Figure 2.
Dante frequency selection for the cell-wall sample of Figure 1. A train of 1-μs 13C radio frequency pulses separated by 5 μs, with the carrier frequency centered at the glycyl-carbon resonance, and followed by z-axis storage for 200 ms, partially inverted the peak at 42 ppm (middle). The Dante difference spectrum (top) shows 13C–13C spin diffusion from the glycyl label to the d-alanyl label (175 and 178 ppm) and the l-alanyl label (15 ppm). The dotted lines above the peaks of the middle spectrum show their heights in the bottom spectrum. Spinning sidebands are designated by “ssb”.

