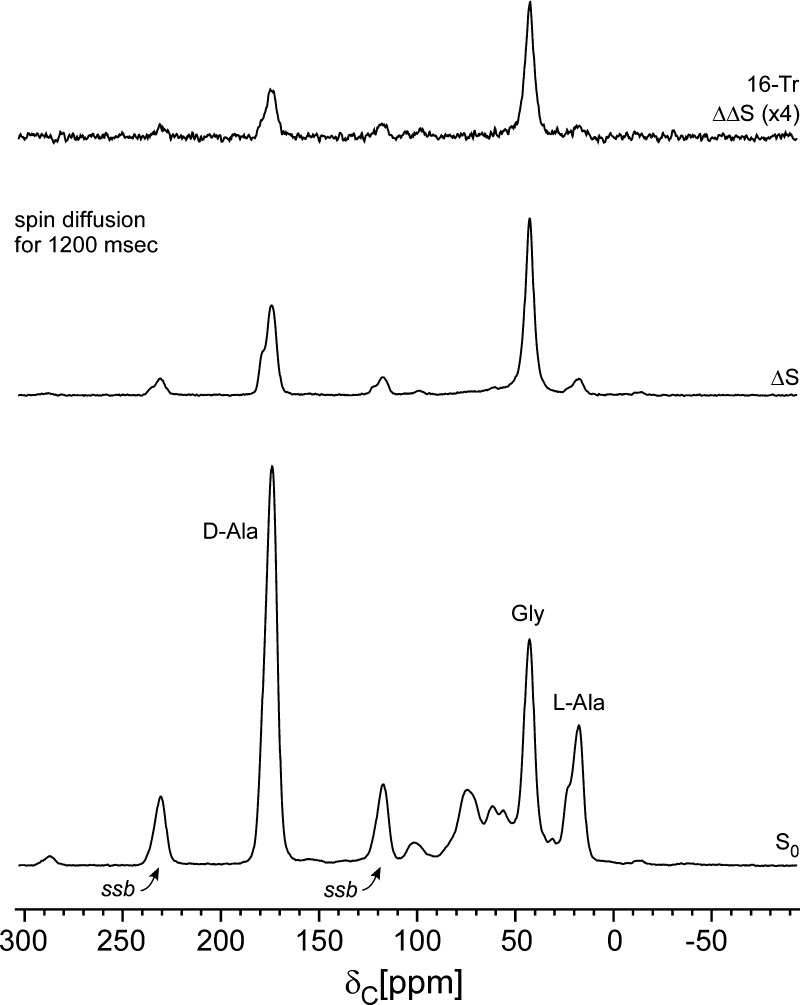
Figure 5.
Dante-selected C{F} REDOR of the cell-wall sample of Figure 1. The Dante differencing of Figure 2 preceded REDOR dephasing but with a mixing time of 1200 ms. Even though the l-alanyl methyl-label peak at 15 ppm has a reduced S0 intensity relative to that in Figure 2 (bottom) because of a short T1(C), the ΔS/S0 for that peak has increased to approximately 15%.

