Figure 3.
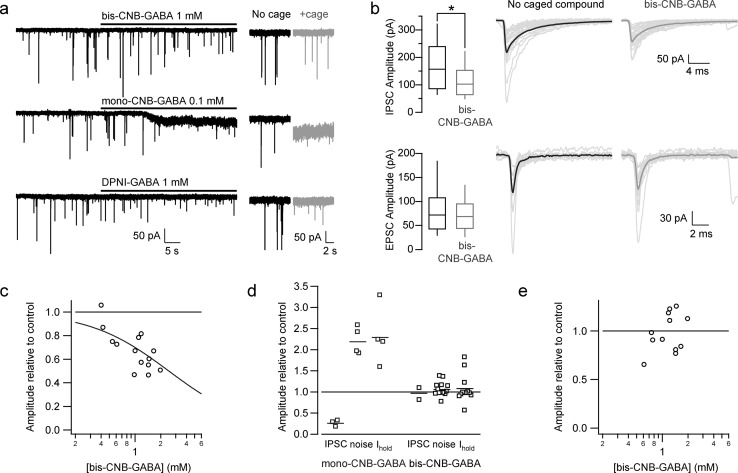
Quantification of unwanted effects of caged GABA. (a) Voltage clamp recordings from cerebellar interneurons exposed to caged GABA. Upper trace, 1 mM bis-CNB-GABA; middle trace, 0.1 mM mono-O-CNB-GABA; bottom trace, 1 mM DPNI-GABA. Right, expanded traces illustrating the detailed effects on steady-state holding current and fluctuations in holding current. (b) Effects of caged GABA on spontaneous IPSCs and excitatory postsynaptic currents (EPSCs). IPSCs and EPSCs were identified and separated based on kinetic criteria. Left, box plots of spontaneous postsynaptic current amplitudes in control conditions and in the presence of 1 mM bis-CNB-GABA. Boxes show interquartile range and whiskers show full range of values. Right, individual traces (gray) and average (block) of detected spontaneous IPSCs and EPSCs. (c) Dependence of spontaneous IPSC amplitude on bis-CNB-GABA concentration. The curve indicates a fit with KD = 2.5 ± 0.2 mM, nH = 0.93 ± 0.09. (d) Comparison of effects of mono-O-CNB-GABA (0.1 mM) and bis-CNB-GABA (1.0 mM, except for 0.4 mM for IPSCs) on spontaneous IPSC amplitude, standard deviation of holding current (noise), and holding current (Ihold). (e) Spontaneous EPSC size was unaffected by bis-CNB-GABA at all concentrations tested.

