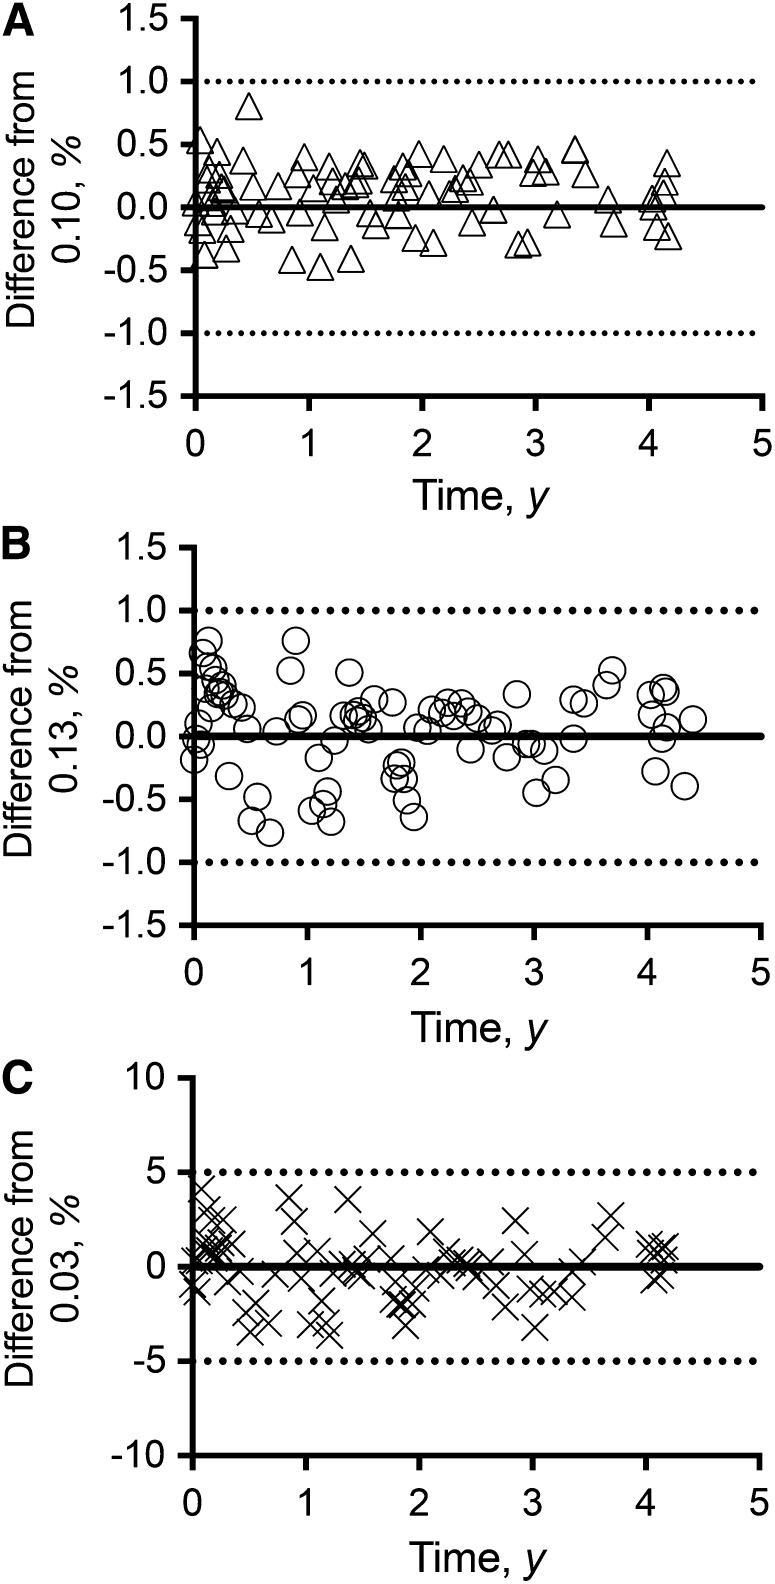
FIGURE 1.
Reproducibility of the DLW method based on the dose-dilution data over 4.4 y (n = 79) in the caloric restriction clinical trial. Shown are the percentage difference of kH with respect to a theoretical value of 0.10 (A); percentage difference of kO with respect to a theoretical value of 0.13 (B); and percentage difference of kO−kH with respect to a theoretical value of 0.03 (C). The symbols within each panel represent the percentage difference for each monthly dose-dilution measurement. The solid line within each panel represents a mean difference of zero. The 2 dotted lines within each panel represent a 1% difference around zero (A and B), and a 5% difference around zero (C). DLW, doubly labeled water; kH, fractional turnover rate of 2H; kO, fractional turnover rate of 18O.

