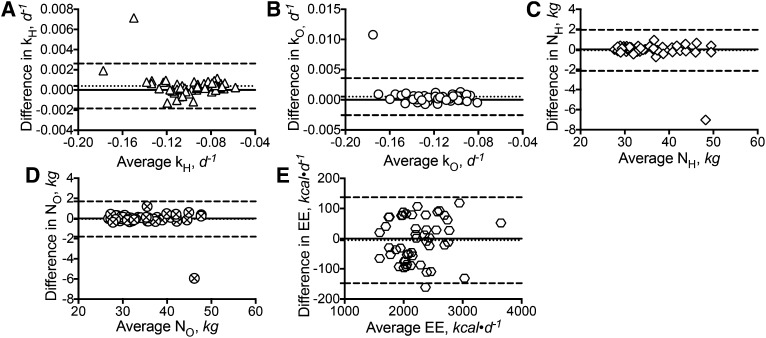
FIGURE 2.
Reproducibility of the DLW method based on outcomes collected from 50 human studies randomly selected from the caloric restriction clinical trial for the test-retest protocol over 2.5 y (n = 50). Shown are the Bland-Altman pair-wise comparison between the retested kH values and the originally calculated kH values (A); Bland-Altman pair-wise comparison between the retested kO values and the originally calculated kO values (B); Bland-Altman pair-wise comparison between the retested NH values and the originally calculated NH values (C); Bland-Altman pair-wise comparison between the retested NO values and the originally calculated NO values (D); and Bland-Altman pair-wise comparison between the retested EE values and the originally calculated EE values (E). The solid line within each panel represents zero difference. The dotted line within each panel represents the bias or mean difference between the retest and original values. The 2 dashed lines within each panel represent the 95% CIs of the bias. The symbols within each panel represent the individual difference between the retest and the original values. DLW, doubly labeled water; EE, energy expenditure; kH, fractional turnover rate of 2H; kO, fractional turnover rate of 18O; NH, isotope dilution space of 2H; NO, isotope dilution space of 18O.

