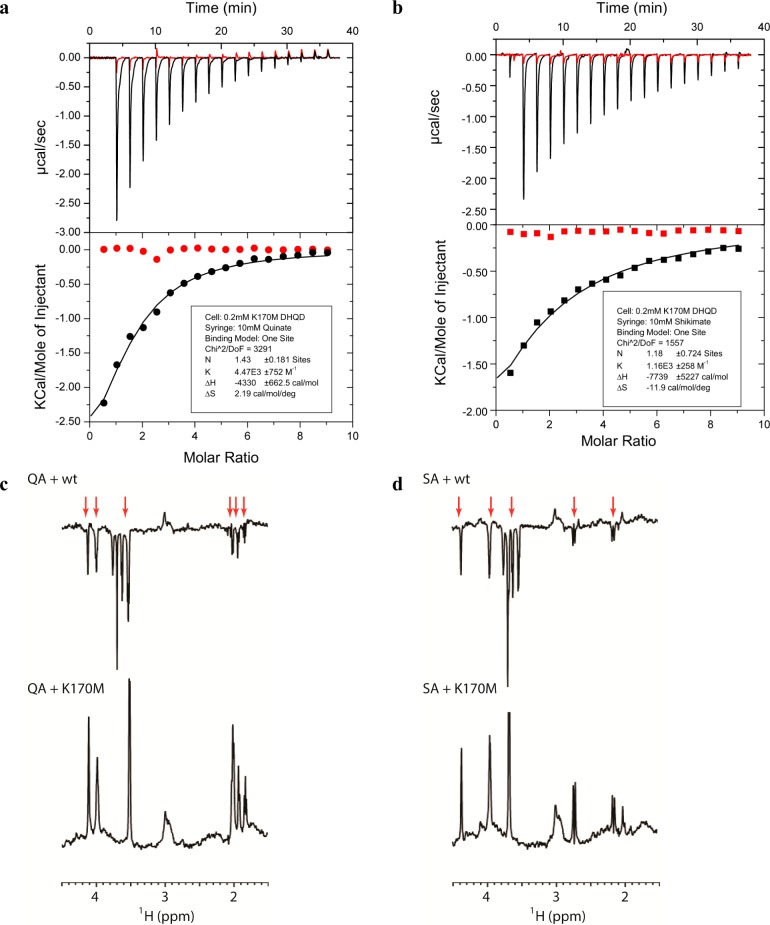
Figure 6.
Binding of quinate and shikimate to wild-type and K170M DHQD. (a) Data from ITC experiments in which 10 mM quinate was injected into 200 μM wild-type (red) or K170M (black) DHQD are shown. The top panel shows the direct heat generated per injection, while the bottom panel shows the integrated and normalized heat data with a curve fit to the K170M DHQD data. (b) Data from ITC experiments in which 10 mM shikimate was injected into 200 μM wild-type (red) or K170M (black) DHQD. The experimental setup and presentation are the same as in panel a. (c) WaterLOGSY NMR spectrum of quinate in the presence of wild-type DHQD (top) or K170M DHQD (bottom). Red arrows denote the resonances corresponding to those of quinate. The negative sign of the quinate peaks in the wild-type spectrum indicates little or no binding. The positive sign of the quinate peaks in the K170M spectrum indicates binding. (d) WaterLOGSY NMR spectrum of shikimate in the presence of wild-type DHQD (top) or K170M DHQD (bottom). Red arrows denote the resonances corresponding to those of shikimate. The negative sign of the shikimate peaks in the wild-type spectrum indicates little or no binding. The positive sign of the shikimate peaks in the K170M spectrum indicates binding.

