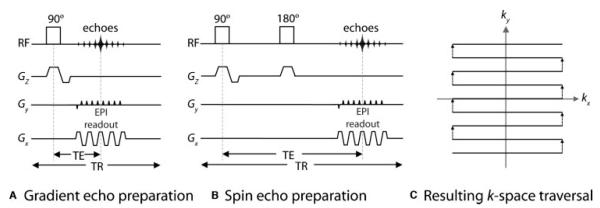
Figure 1.

A typical echo planar pulse sequence timing diagram (EPI) from (A) a gradient echo and (B) a spin echo RF excitation. (C) Resulting imaging data, otherwise known as the EPI“ k-space trajectory.” The gradients in Gz are the slice-select gradients. In the readout direction (Gx), the gradients oscillate rapidly between positive and negative values, corresponding to moving in opposite directions along the kx-axis. A strong “blip” in Gy (the phase-encoding direction) moves the k-space trajectory from one line to the next. Thus the whole of k-space (corresponding to one complete image) is filled in one repetition (TR). TE is the echo time, determined by the distance from the middle of the 90-degree RF pulse to the center of the largest echo (i.e., the center of k-space). RF, radiofrequency.
