Figure 11.

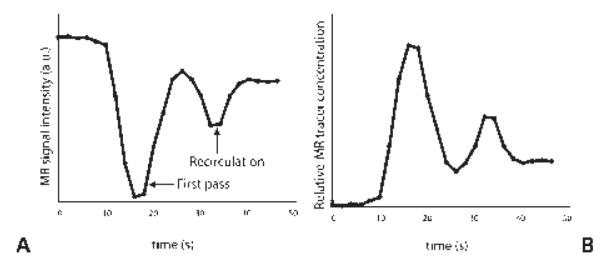
(A) Plot of the signal from a T2*-weighted sequence after injection of a contrast bolus as it travels through a region of interest in the brain. In (B), the signal is converted to concentration versus time.

(A) Plot of the signal from a T2*-weighted sequence after injection of a contrast bolus as it travels through a region of interest in the brain. In (B), the signal is converted to concentration versus time.