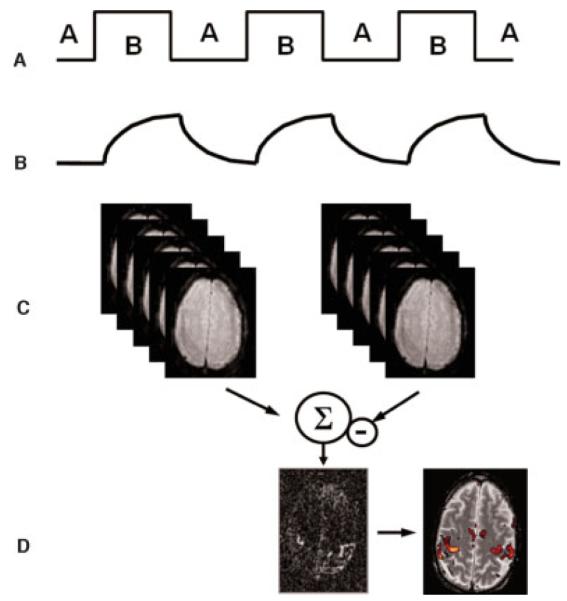
Figure 2.

fMRI processing. (A) A usual fMRI experiment is conducted by alternating between two states (A, B); for example, stimulation on/off. (B) The tissue response follows the stimulation pattern determined by the hemodynamic response function. In the activated state B, the fMRI signal increases due to the prolonged T2* time. (C) A combination of the images from states A and B leads to (D) an image that demonstrates contrast in areas where functional activation occurred. For better localization, the activation results can be overlaid onto a morphologic reference image. This allows investigators to determine gray and white matter boundaries precisely as well as to delineate activated and nonactivated borders. fMRI, functional magnetic resonance imaging.
