
FIG. 4.
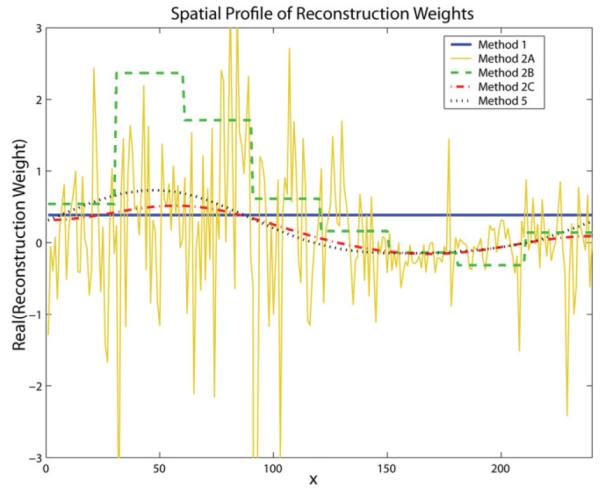
Representative reconstruction weights for the dataset in Fig. 2 are plotted vs. x-position for different CCDD methods. Method 1 weights exhibit no dependence on x (horizontal line), Method 2A weights fluctuate with each increment in x, Method 2B weights display a segmented dependence on x (Nseg = 8), whereas Method 2C and 5 weights exhibit smooth, low-frequency spatial variation over x. [Color figure can be viewed in the online issue, which is available at http://www.interscience.wiley.com.]