Figure 1.
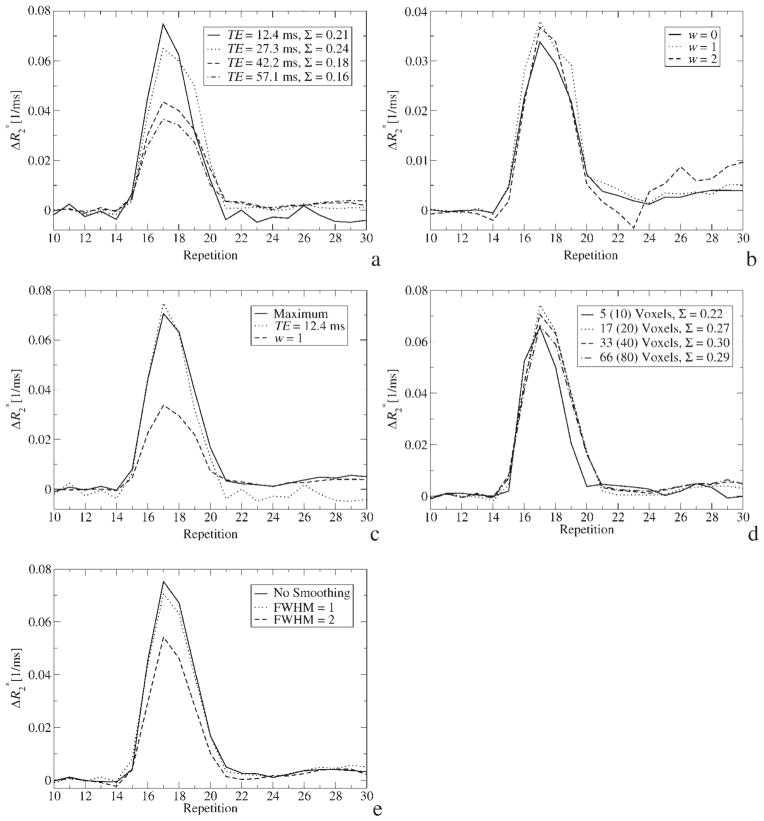
(a) AIF calculated from different echoes. The AIF averaged over the time course of ~30 automatically selected voxels. The FWHM of in-plane smoothing was 1.0. Please note that, owing to the differing input to the automatic selection of AIF voxels, different clusters of voxels were used for AIF calculation. The integral over each time course is given by Σ in arbitrary units. (b) AIF calculated from weighted fit with different error-weighting exponents w (see text). Other parameters were the same as in (a). (c) AIF calculated from the maximum of the AIF from the first echo and the weighted fit with w = 1. Please note that the actual values of the combined AIF are slightly different from those of the constituent curves because there is a minor variation of the locations of automatically selected voxels. (d) Influence of the number of AIF voxels on the shape of the AIF. Note that the actual number of voxels is less than N (which is specified in brackets) because of the next-neighbor analysis as described in the text. The integral over each time course is given by Σ in arbitrary units. (e) The effect of in-plane smoothing with a Gaussian kernel of different width on the shape of the AIF. Data is from 33 automatically selected voxels

