
FIGURE 2.
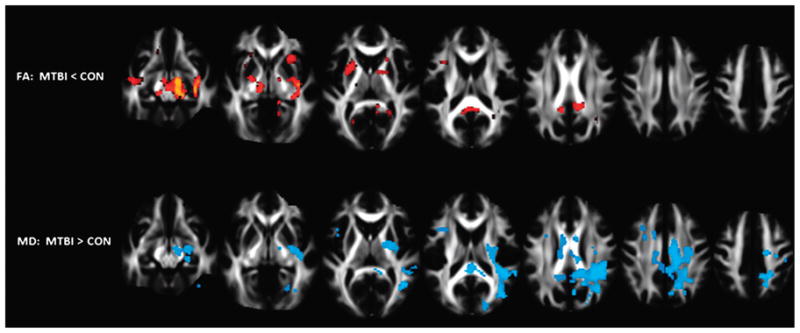
Voxel-based analysis results overlaid on selected axial slices from the mean FA template derived using 40 healthy controls (CON) and 60 patients with MTBI scanned within a few days of injury. The top and bottom rows depict voxel clusters where the mean FA and MD of patients were significantly greater and less than controls, respectively, at P < 0.05 corrected for age, sex, education, and multiple comparisons. Figure courtesy of Arnaud Messé, PhD, Laboratoire d’Imagerie Fonctionnelle, Paris, France. Figure 2 can be viewed online in color at www.topicsinmri.com.