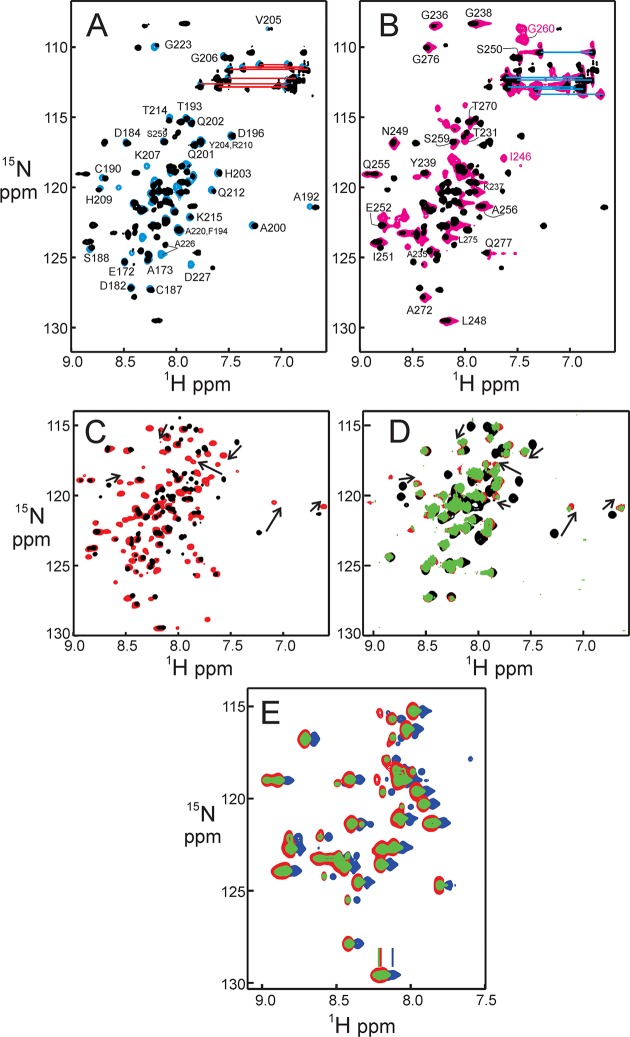
Figure 3.
1H–15N HSQC spectra of JAZ zinc finger domains. (A) Superposition of the 600 MHz spectrum (298 K) of ZF34 (black) with that of ZF3 (blue). Red horizontal lines denote resonances of side-chain carboxamide groups of Asn and Gln residues. Representative assignments are indicated. (B) Superposition of the 600 MHz spectrum (298 K) of ZF34 (black) with that of ZF4 (magenta). Blue horizontal lines denote resonances of side-chain carboxamide groups of Asn and Gln residues. Representative assignments are indicated. Labels in red indicate resonances that are observed for ZF4 but not for ZF34. (C) Superposition of part of the 800 MHz spectrum (298 K) of 100 μM ZF34 (black) with that of 100 μM ZF34 in the presence of 220 μM VAI T57A RNA (red). Some weak peaks are missing in the spectrum of ZF34 because of exchange broadening. (D) Superposition of part of the 600 MHz spectrum (298 K) of 50 μM ZF3 (black) with that of 63 μM ZF3 in the presence of 120 μM VAI T57B (red) and that of 50 μM JAZ ZF3 in the presence of 100 μM duplex III (green). (E) Superposition of part of the 750 MHz spectrum (298 K) of 100 μM ZF4 (blue), that of 100 μM ZF4 in the presence of 200 μM duplex III RNA (red), and 100 μM ZF4 in the presence of 300 μM duplex III RNA (green). The blue (free protein) spectrum has been offset to the right for clarity by an amount indicated by the vertical lines at the bottom of the figure.

