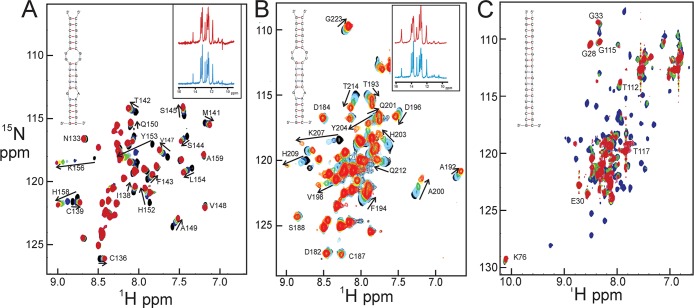
Figure 4.
(A) NMR titration of JAZ ZF2 with increasing concentrations of VAImin RNA. The spectra are colored by molar ratio: free ZF2, black and [RNA]/[ZF2] 0.5, blue; 1.0, cyan; 1.5, green; 2.2, yellow; 3.7, magenta; and 3.8, red. Inset: 1D 1H spectra (imino proton region) of free VAImin RNA (cyan) and of a 1:1 complex with JAZ ZF2 (red). The structure of VAImin is shown at the top left. (B) NMR titration of JAZ ZF3 with increasing concentrations of VAImin RNA. The spectra are colored by molar ratio: free ZF3, black and [RNA]/[ZF3] 0.2, blue; 0.4, cyan; 0.6, green; 0.8, yellow; 1.0, orange; and 2.0, red. Inset: 1D 1H spectra of free VAImin RNA (cyan) and of a 1:1 complex with JAZ ZF3 (red). The structure of VAImin is shown at the top left. (C) NMR titration of JAZ ZF1 with VAIminMut RNA. The spectra are colored by molar ratio: free ZF1, blue and [RNA]/[ZF1] 0.04, cyan; 0.1, green; 0.2, yellow; 2.0, magenta; and 2.5, red. The structure of VAIminMut is shown at the top left.

