Figure 8.
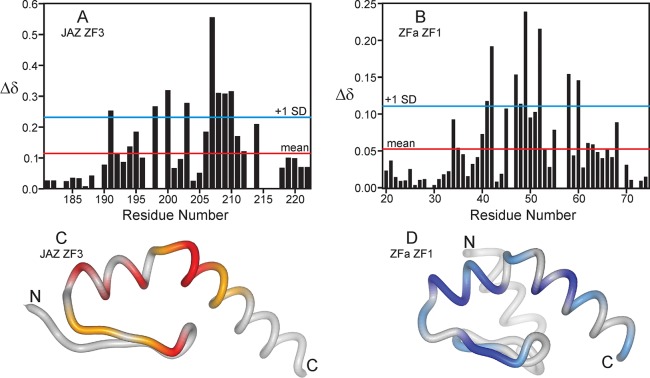
(A, B) Perturbation of the backbone amide (1H and 15N) resonances of (A) JAZ ZF3 and (B) ZF1 of the homologous protein ZFa. Δδ = [(ΔδHN)2 + (ΔδN/5)2]1/2. Red horizontal lines indicate the average Δδ (0.115 for JAZ ZF3 and 0.053 for ZFa ZF1), and blue lines indicate [average + 1× standard deviation] (0.122 for JAZ ZF3 and 0.056 for ZFa ZF1). (C, D) Backbone representation of the lowest-energy structures from the ensembles of (C) JAZ ZF3 and (D) ZFa ZF1.15 Residues for which Δδ > [average + 1× standard deviation] are colored red and blue for JAZ ZF3 and ZFa ZF1, respectively, and residues for which [average + 1× standard deviation] < Δδ < [average] are colored orange and light blue for JAZ ZF3 and ZFa ZF1, respectively. ZFa ZF1 has an extension (light gray) at the N-terminus consisting of a third helix and a third β-strand.15 Disordered residues at the termini have been omitted from the representation of both structures. Figure made with Molmol.57

