Abstract
Many viruses undergo large-scale conformational changes during their life cycles. Blocking the transition from one stage of the life cycle to the next is an attractive strategy for the development of antiviral compounds. In this work, we have constructed an icosahedrally symmetric, low-energy pathway for the maturation transition of bacteriophage HK97. By conducting constant-pH molecular dynamics simulations on this pathway, we identify which residues are contributing most significantly to shifting the stability between the states along the pathway under differing pH conditions. We further analyze these data to establish the connection between critical residues and important structural motifs which undergo reorganization during maturation. We go on to show how DNA packaging can induce spontaneous reorganization of the capsid during maturation.
Introduction
Numerous viruses undergo structural transitions during their life cycles. For many systems a virus receives a signal from the environment which triggers a transition to the next stage in its development. These signals can come in the form of a direct interaction (i.e., receptor binding) or through more passive mechanisms, such as changes in pH or ionic strength. Many viruses enter cells and are trafficked through the endosomal system, where they encounter acidic environments (pH = 4.0–6.5) compared to the extracellular conditions.1 In certain cases, these viruses have evolved to exploit the cellular acidic compartments, where the virus structure responds via spontaneous configurational changes that facilitate the ability to infect the host. Examples of acid-dependent entry mechanisms include influenza,2 alphaviruses,3,4 West Nile virus,5 as well as many other human- and nonhuman-infecting viral species.6
The bacteriophage HK97 infects Escherichia coli and is a model system for understanding virus maturation, as extensive structural and biophysical data are available.7−15 While in vivo maturation is triggered by DNA packaging, in vitro, an analogous structural transition to the capsid can be accomplished in the absence of DNA, triggered by acidification (pH ≈ 4).16 Wild-type HK97 has the unique feature of forming protein catenanes in the mature capsid through a cross-linking reaction between neighboring protein subunits.7,17,18 While the formation of cross-links renders the maturation transition irreversible,19 it remains unclear what role the cross-links play in driving the transition. Most striking is the fact that a cross-link deficient mutant (K169Y), is capable of undergoing an analogous transformation resulting in a structure which is nearly identical to the wild-type mature capsid in the hexamers but with slightly less protruding pentamers.10
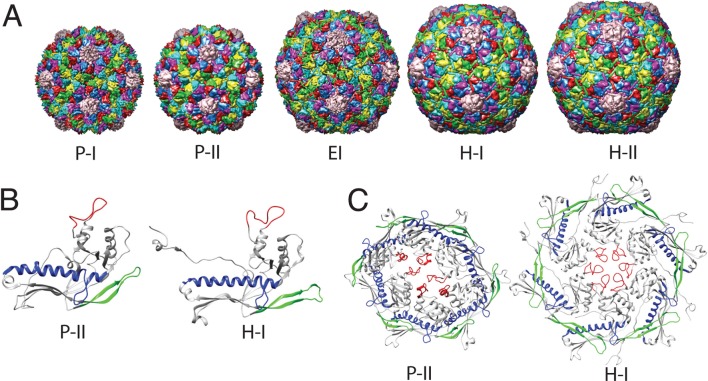
In vitro, closed capsids of HK97 can be assembled by expressing the major capsid protein gp5. The shells consist of 420 copies of the subunit protein and are arranged into hexamers and pentamers obeying a T = 7 Caspar–Klug architecture.20 This initial structure is know as Prohead-I (P-I),15 but is unstable when coexpressed with the protease gp4. The gp4 protease cleaves 102 N-terminal residues from each of the subunit proteins and promotes a structural reorganization, resulting in the spherical particle known as Prohead-II (P-II). P-II is the stage where DNA would begin to package, causing the particle to expand and facet, leading to the fully mature Head-II (H-II) structure. In the cross-link deficient mutant, the final configuration is termed Head-I (H-I). The structural change between P-II and H-I/II is very dramatic, involving a 50 Å radial expansion, morphological changes from spherical to icosahedral, as well as inter- and intrasubunit rearrangements. In both the wild-type and mutant pathways in vitro it is believed the transition involves an intermediate state.10,12 Earlier work suggested that several intermediate states existed along the pathway,8,18 but that view has eroded, and now it is believed there is just a single intermediate state, termed expansion intermediate (EI), which separates P-II from H-I.13,14,21 A model of EI was constructed by fitting the H-II coordinates into cryo-electron microscopy (cryo-EM) maps of the intermediate, which was trapped using low pH conditions.12 While low pH will initiate the expansion/maturation process in vitro, it is not sufficient to reach the H-I/II state. The capsid will only reach the intermediate stage at low pH, and in order to complete the transition, the system must be returned to a neutral pH environment. The structures of the different states of HK97 are shown in Figure 1A, while the subunit and hexamer structure of P-II and H-I are presented in B and C, respectively, of Figure 1.
Figure 1.
HK97 capsid structures. (A) Full capsids: from left to right, Prohead-I (PDB ID: 3P8Q), Prohead-II (3E8K), Expansion Intermediate (3DDX), Head-I (2FS3), Head-II (1OHG). (B) Subunit structure: The A-subunit of the P-II and H-I structures are shown, the E-loop (residues 148–181) is colored green, the A-loop (residues 288–303) is colored red, and the spine helix (residues 200–240) is colored blue. (C) Hexamer structure of the P-II and H-I structures are shown with the same secondary structure coloring as in (B).
In this work we focus on the transition between P-II to H-I via EI by examining a low-energy pathway which conserves icosahedral symmetry. While the maturation of HK97 has been studied for many years, both experimentally and theoretically, in previous studies either only a few states of the pathway have been examined, or if time-resolved methods were employed, the structural resolution has been quite low. Previous studies on the maturation pathway include those employing biochemical methods,18,22 small-angle X-ray scattering (SAXS),8,12,16,23 hydrogen/deuterium (H/2H) exchange,14,21 cryo-EM,8,10 atomic force microscopy (AFM),24 normal-mode analysis (NMA),25−28 and coarse-grained molecular dynamics using a structure-based potential.29 This study provides a higher level of spatial resolution into the maturation process than previous works, through the utilization of all-atom molecular dynamics simulation. We gain further insight by utilizing constant pH molecular dynamics (CPHMD),30,31 which allows us to estimate pKa’s of titratable groups and calculate pH-dependent free energy changes in the stability of the capsid. With these methods we are able to uncover the free energy landscape that governs the dynamics of maturation and understand how that surface is influenced by the chemical perturbation of acidification.
Materials and Methods
Pathway Generation and Refinement
The end points for our pathway calculation were the P-II (PDB ID: 3E8K) and H-I (PDB ID: 2FS3) structures determined by X-ray crystallography.10,13 Since the H-I structure contains the mutation K169Y, this mutation was incorporated into each of the seven subunit proteins in the P-II asymmetric unit structure using the mutate.pl script from the MMTSB toolset,32 so that both end points have an equivalent atomic composition. In all molecular simulations in this study we used the CHARMM simulation package33 with the CHARMM27 force field34,35 including the CMAP correction term.34 The simulation system was the seven protein asymmetric unit, which consisted of a total of 1960 residues and 29911 atoms; in all energy minimizations and molecular dynamics (MD), icosahedral symmetry was enforced on the full capsid, by the rotational symmetry boundary condition method36 and the IMAGE facility in CHARMM. The choice to constrain the system to obey icosahedral symmetry provides a significant (∼60×) computational advantage, and is justified by a recent study in which the symmetry constraint was not enforced, yet the pathways retained much icosahedral character.29
The initial pathway between the end point structures was built using linear interpolations in both Cartesian and internal coordinates, combined with shrinking of the amino acid side chains. Specifically, first backbone atoms were interpolated in the Cartesian space, and then side chain atoms were shrunk to half the original size before finally building them onto the interpolated backbone. This step was followed by short constrained minimization of each bead during which the side chains are restored to their original size. Previously, this approach of building the initial pathway between known end-point states has been shown to produce reasonably low energy paths compared to plain all-atom linear interpolation in Cartesian coordinate space.37 The initial pathway consisted of 120 structures, spaced in ∼0.5 Å increments in RMSD space. Initial energy minimization was performed on each of the structures with a 100 kcal/mol·Å2 positional restraint on the backbone atoms for 1000 steps with a steepest descent (SD) algorithm followed by 2000 steps with an adopted basis Newton–Raphson (ABNR) method and using the GBMV implicit solvent model.38,39
Starting from this initial minimized pathway, we refined the conformational change pathway using the string method40 in conjunction with the harmonic Fourier beads path interpolation method (HFB)41,42 implemented in CHARMM through the TREK module. The string of structures was evolved to yield a minimum energy pathway. During each cycle of HFB refinement, the reactive coordinate set (RCS) was chosen to be all backbone atoms, which were restrained with a weak (1 kcal/mol·Å2) positional restraint. In each cycle of HFB, energy minimization was performed for 500 steps using SD followed by 2000 steps with ABNR. Following the minimization, the string was updated by the generalized gradient-augmented HFB (gga-HFB) method in which a harmonic approximation of the energy surface is calculated, and the structures are displaced along the gradient, to allow local energy barriers to be overcome. The stepping parameter was set to 0.000125, and 96 basis functions were used to reparameterize the string following the gradient stepping, to keep the beads equally spaced along the pathway. HFB was performed for 132 cycles using the GBMV implicit solvent model, and then an additional 68 cycles of HFB were performed using the GBSW implicit solvent model43 with a salt concentration of 0.1 M. A total of 200 cycles of HFB refinement was performed. The convergence of the pathway refinement was monitored by energy and structural metrics, as shown in Figure 2. Throughout the manuscript we will refer to the 120 structure energy minimized refined pathway as bead 0 through bead 119.
Figure 2.

Convergence of pathway to a minimum energy stable path. (A) Potential energy evolution through successive HFB cycles. (B) RMSD evolution through successive HFB cycles. Each structure (bead) was aligned with its corresponding bead from the initial path, and the RMSD was calculated over the heavy (non-hydrogen) atoms. (C) Summed RMSD evolution. The individual bead RMSDs, with respect to their corresponding beads in the initial path, are summed over all beads in the path. The flattening of this curve indicates convergence of the HFB string energy.
Umbrella Sampling Simulations
The structures from the final (200th) cycle of HFB were then subjected to umbrella sampling MD simulations using CPHMD30 to maintain pH 7 conditions and a salt concentration of 0.1 M. The GBSW implicit solvent generalized Born model43 was used during umbrella sampling. Each structure was minimized under these conditions for 500 steps with SD, followed by 500 steps with ABNR, while restraining all non-hydrogen atoms with a 10 kcal/mol·Å2 positional restraint. Following the minimization, the positional restraints were removed and a center of mass restraint was imposed to keep the structure near a fixed radial value. The radial restraint was implemented with the CHARMM CONS HMCM command, which restrains the center of mass (COM) of the atom selection to a reference position. The functional form of the restraint energy is, U = k*Δ2, where Δ is the distance been the atom selection (all backbone atoms) COM and the reference position. Each structure was equilibrated under a high restraint (50 kcal/mol·Å2) for a minimum of 1.2 ns. Production umbrella sampling was performed for 3.0 ns with a 10 kcal/mol·Å2 center of mass restraint. All umbrella sampling simulations were performed at constant volume using a Langevin integration scheme coupled to a bath at T = 300 K with a 5.0 ps–1 friction coefficient on all non-hydrogen atoms, and a 2.0 fs time step. Histidine, aspartic acid, and glutamic acid residues protonation states were allowed to fluctuate, via the CPHMD implementation. The total simulation time was greater than 0.5 μs. A similar approach of combining HFB with CPHMD was recently employed to study conformational changes in GPCR rhodopsion.44
Potential of Mean Force
The production umbrella sampling simulations were used for the potential of mean force (PMF) calculations and for estimating pKa values. The weighted histogram analysis method (WHAM)45,46 was used to construct an unbiased PMF along the radial expansion coordinate, using the code provided by Alan Grossfield (http://membrane.urmc.rochester.edu/content/wham). From the 3.0 ns of production umbrella sampling data two separate PMFs were computed, corresponding to the first 1.5 ns and the last 1.5 ns of production data. The PMFs were converged using 60 windows at 10–5 kcal/mol tolerance; further reduction of the tolerance criteria did not significantly change the PMFs. The two PMFs were averaged, and error bars were computed as shown in Figure 3.
Figure 3.
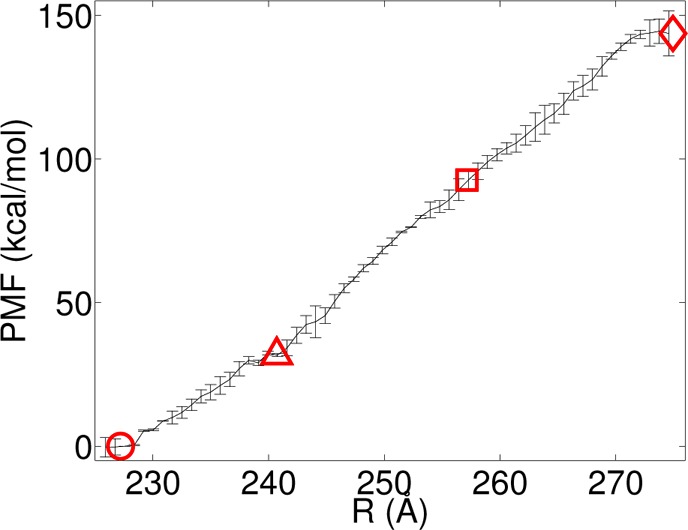
Potential of mean force for capsid expansion at pH 7. The radial value of P-II, PEI, EI, and H-I are indicated by the red circle, triangle, square, and diamond, respectively.
pKa Calculations
During CPHMD a dynamic variable, λ, is propagated according to the extended Hamiltonian equations of motions,31,47 taking on values between 1 (fully deprotonated) and 0 (fully protonated). To determine the pKa’s of the titrating residues we calculate the fraction of unprotonated (Sunprot) states by
| 1 |
where Nunprot corresponds to λ > 0.9 and Nprot corresponds to states with λ < 0.1. The first 1.2 ns of each umbrella sampling window was discarded, and the remaining data (minimally 3 ns/window) were used to calculate Sunprot. The pKa’s were then estimated from the generalized Henderson–Hasselbach equation,
| 2 |
where n is the Hill coefficient, which is related to the cooperativity between titrating residues. We have set n = 1 in our calculations of the pKa’s, as small deviations from n = 1 have little effect on the resultant free energy changes.48
Structural Analyses
The spine helix kinking angle was calculated by considering the angle between the center of geometry of the backbone atoms for the following three residues: 202, 209, and 216. The E-loop rotation was calculated by aligning each subunit protein to its corresponding subunit protein in the initial (P-II) state. The alignment was performed using residues 200–300. The angle was calculated by defining 3 points, one at the base of the E-loop in both the initial and current states (center of geometry of the set of residues 152–154, 176–178), and a point at the tip of the E-loop of the current state (center of geometry of residues 162–169).
Results and Discussion
We have utilized free energy simulation based methods at constant pH to understand the overall thermodynamics of the expansion/maturation process and also have identified residues that contribute most significantly to both stabilizing the procapsid state and those involved in driving the transition toward the mature state. We first discuss the global dynamics to understand the overall transition process. We then move on to present and discuss the residues which are most critical to controlling the maturation transition and how these residues are involved in reorganization of specific structural motifs in the capsid. Lastly, we consider the relationship between pH-induced maturation and DNA-driven maturation.
Global Dynamics
We have computed the free energy profile (PMF) of HK97 expansion at pH 7 from our umbrella sampling data. The profile is presented in Figure 3, and at neutral pH the profile is uphill, with a few local minima along the path. The magnitude of the free energy change between H-I and P-II is 150 kcal/mol, which at first glance appears to be a tremendous amount of energy. However, this energy change is for the full capsid, which contains 420 proteins, so on a per protein basis the energy requirement is not that significant. Our estimate of ΔG = 150 kcal/mol appears to underestimate the free energy change as measured by differential scanning calorimetry (DSC) at pH = 7.5 (250 kcal/mol),19 but the sign and order of magnitude are consistent with experiment, and there is a pH difference between our PMF calculation conditions and the experimental measurements (see discussion below). The radial values of P-II, EI, and H-I are mapped onto the PMF, and it can be seen that both P-II and H-I lie in flat regions, while the intermediate lies just past a small bump in a relatively flat region of the landscape. There are some local minimum free energy states observed around 240 Å, which may correspond to an early stage intermediate state. We denote this state around 240 Å and as a putative expansion intermediate (PEI), and is also mapped onto the PMF.
To validate that our pathway does pass through the known intermediate state, we performed structural comparisons between our pathway structure and the EI structure. However, the EI structure is a pseudoatomic model, derived from rigid-body fitting of the H-II coordinates into a 14 Å cryo-EM map of EI.12 To compare our pathway structures with EI within the experimental resolution, we computed cross-correlation coefficients (CCC) between simulated density maps at 14 Å resolution, according to
| 3 |
where S and E represent the simulation and experimental maps being compared. The generation of the maps and rigid-fitting were performed with the SITUS program,49 and the CCC computations were performed with the VMD mdff plugin.50 At the intermediate state region in our landscape, the CCC is maximized and reaches a value of 0.92. We also computed the slope of the PMF to illustrate the intermediate lies just beyond a low-slope region in the landscape, Figure 4.
Figure 4.
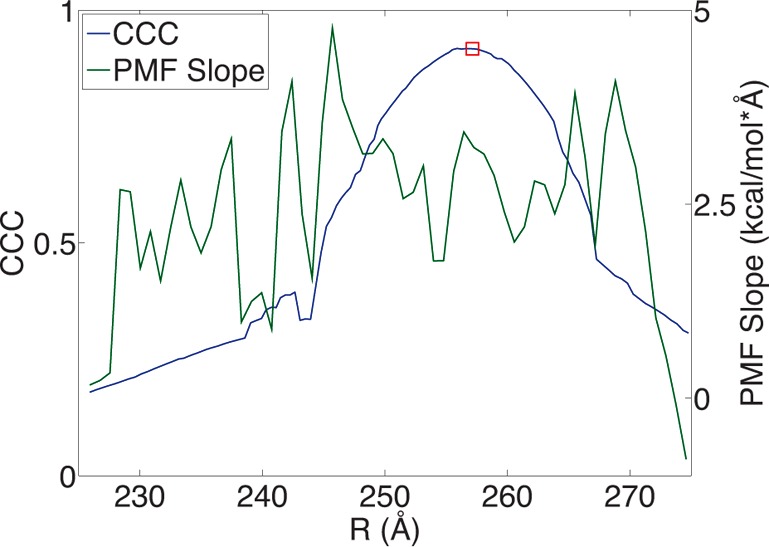
Intermediate validation. The cross-correlation coefficient between simulated maps of the EI PDB structure and pathway intermediate states is plotted against the left axis. The location of the EI state from our pathway is marked as a red square. The slope of the PMF (Figure 3) is plotted against the right axis.
Stability between P-II, EI, and H-I States
From biochemical and structural experiments we know that maturation will proceed at low pH; however, it does not go to completion.16,22 Reneutralization is required to reach the mature state. So if we consider this to be a three-state process, characterized by two ΔGs, ΔG1 (P-II to EI) and ΔG2 (EI to H-I), we can calculate how these ΔGs are effected when the pH is perturbed away from pH 7. The theory which underlies these calculations is given by the Wyman–Tanford linkage equation,51,52
| 4 |
which describes how the free energy changes as a function of pH. Equation 4 is a function of the net charge (ΔQ) difference between states A and B; R is the gas constant, and T is the temperature. Equation 4 can be integrated to give the free energy change as a function of pH,
 |
5 |
where the sum is taken over all titrating residues in the pH range of interest (in our case HIS, GLU, and ASP). The reference pH can, in principle, be any number, but we will set pHref = 7, since we have computed a PMF at pH 7.
We have computed the ΔΔG curves for both the P-II to EI transition and the EI to H-I transition; these curves are shown respectively in A and B of Figure 5. The stability between the states is correctly predicted: the transition from P-II to EI is more favorable at low pH, while the transition from EI to H-I is more favorable at neutral pH. These calculations support a pH-stability switch mechanism to control the maturation process. We have mapped these changes onto our computed PMF at pH 7 to observe how pH modulation alters the expansion free energy landscape, as shown in Figure 5C. By lowering the pH the landscape is tilted, creating a deep well around the EI state. Increasing the pH will then reduce the barrier for reaching the H-I state, becoming nearly flat around pH = 6.5. Interestingly, the overall ΔG at pH = 7.5 increases compared to ΔG(pH 7). Our prediction of the P-II to H-I ΔG(pH 7.5) = 206 kcal/mol is in closer agreement with the DSC measurement, ΔG(pH 7.5) = 250 kcal/mol.
Figure 5.
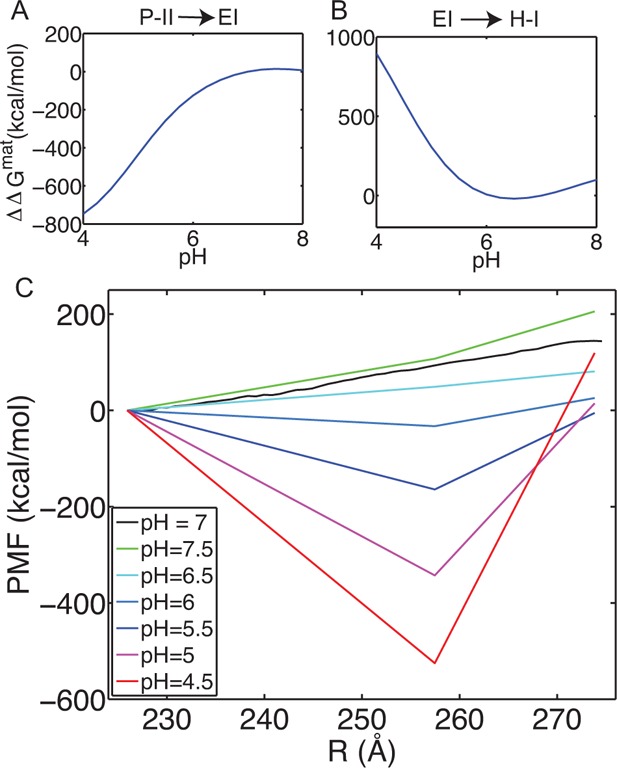
pH effects on the free energy landscape. The ΔΔG for the transition between P-II and EI (A) and for the transition between EI and H-I (B). (C) Maturation free energy landscape as a function of pH for a simplified three-state surface. The PMF at pH 7 is the same curve as in Figure 3. The other curves are generated by considering the three structural regions, P-II, EI, and H-I as defined by beads 0–5, 75–79, and 115–119, respectively, and computing the ΔΔG according to eq 5, and then adding those differences to the computed PMF at pH 7.
The ΔG between H-I and EI does not become negative in the range of pH we examined, which is inconsistent with experimental observations. At pH 6.5 the ΔG is 32 kcal/mol, which on a per protein basis is only 0.08 kcal/mol. At the H-I state we do see the PMF take on a negative slope (Figure 4), and it is possible a deeper minimum exists at a larger radius, which was not sampled in our simulations. There are a variety of possibilities which could lead to such a discrepancy including the force field, the implicit solvent model, inadequate sampling, or the symmetry constraint.
Potential Intermediate State at 240 Å
On the basis of the observation of a flat region of the PMF around 240 Å, and some structural features which display interesting dynamics in this region (see below), we have performed pH stability calculations about this state. Analogous to the calculations in the above section, here examinations of the stability between P-II, PEI (beads 30–35), and EI are made. We observe the PEI state also exhibits stability under low pH conditions, Figure 6A, and transition out of the state is favored at higher pH. We again map the ΔΔGs onto our pH 7 PMF, but here we also consider points in between each of our states (P-II, PEI, E-I, H-I), to investigate if there are pH-dependent barriers separating the states and to better represent the complexity of the landscape. These potential barriers were simply chosen as the midpoint (in bead-space) between each of the four stable states. Interestingly, these states do appear to act as barriers between the “stable” states and act in a pH-dependent fashion. These calculations illustrate how sensitive the free energy landscape is to pH modulation.
Figure 6.
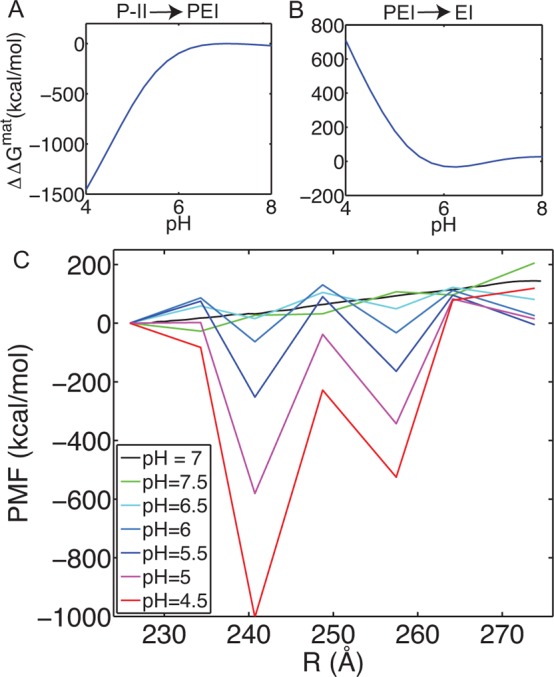
pH effects on the free energy landscape including PEI and potential barrier states. ΔΔG for the transition between P-II and PEI (A) and for the transition between PEI and EI (B). (C) Maturation free energy landscape as a function of pH for a complex surface. P-II, PEI, EI, and H-I are considered as well as an intermediate point between each of the states.
Important Local Interactions and Structural Motifs
Our estimates of the pKa values for the titrating residues (we considered HIS, GLU, and ASP), give us insights into the most critical interactions controlling the expansion of the capsid. In order to identify which residues have the largest contributions to regulating the structural transition, we average the pKa’s over adjacent structures in the pathway and also over identical residues in the hexamer. In effect we are improving sampling by 30-fold by using 5 adjacent structures from the pathway, and then the 6-fold improvement by averaging over the hexamer subunits. We compared the pKa’s between the P-II state (beads 0–4) and the EI state (beads 75–79) and calculated how those pKa differences result in changes in ΔG (i.e., ΔΔG) at low pH, according to eq 5. Those residues which have large (positive or negative) resultant ΔΔG, are those residues whose pKa changes significantly between P-II and EI. Those residues which have positive ΔpKa’s (ΔpKa = pKa(EI) – pKa(P-II)) we refer to having upshifted pKa’s, and conversely those residues with negative ΔpKa’s, we refer to as residues with downshifted pKa’s. In Table 1 we present the five residues with the most negative ΔΔG (downshifted pKa’s) and the five residues with the most positive ΔΔG (upshifted pKa’s). These residues are displayed on the hexamer structure of P-II in Figure 7. What can be immediately recognized is that the residues with down-shifted pKa’s (colored red) exist at the hexamer boundary and are presumably involved in capsomer–caposmer interactions, while the residues with upshifted pKa’s are more interior to the hexamer and exist primarily at subunit–subunit interfaces. Those residues which have upshifted pKa’s have a propensity to protonate and therefore, the interactions which are formed in the P-II state are likely to be dynamic, whereas those structures which have downshifted pKa’s are resisting protonation and therefore are more likely to be conserved interactions through the transition.
Table 1. Residues with Largest Magnitude pKa Shifts between P-II and EI; Presented pKa Values Have Been Averaged over Identical Residues in the Hexamer.
| residue | P-II pKa | EI pKa | ΔpKa | ΔΔG ((pH = 4; pHref = 7) (kcal/mol) |
|---|---|---|---|---|
| ASP 173 | 4.04 | 5.04 | 1.00 | –1.04 |
| GLU 153 | 4.96 | 5.69 | 0.73 | –0.93 |
| GLU 292 | 4.56 | 5.27 | 0.71 | –0.85 |
| ASP 290 | 3.88 | 4.74 | 0.86 | –0.77 |
| GLU 149 | 4.33 | 4.98 | 0.66 | –0.72 |
| — | — | — | — | — |
| GLU 344 | 5.39 | 4.59 | –0.80 | 0.98 |
| GLU 267 | 5.21 | 4.59 | –0.61 | 0.74 |
| ASP 198 | 4.77 | 4.03 | –0.74 | 0.71 |
| GLU 363 | 6.12 | 5.57 | –0.55 | 0.69 |
| ASP 231 | 5.22 | 4.68 | –0.54 | 0.65 |
Figure 7.
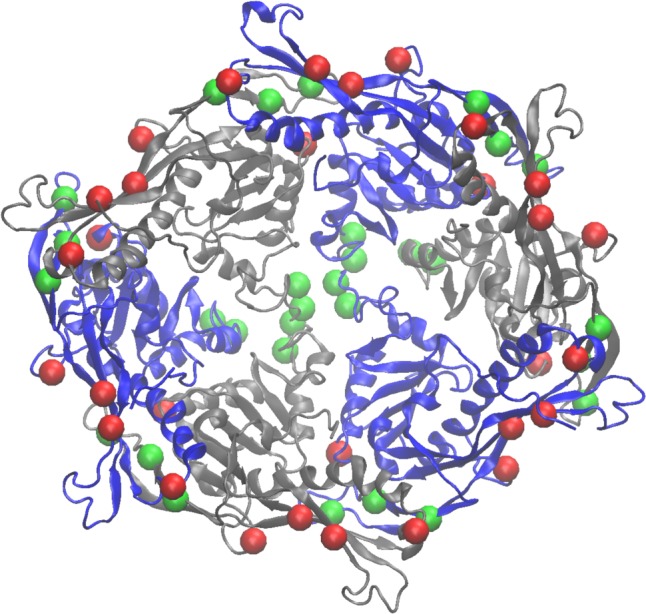
pKa-shifted residues mapped onto the P-II hexamer. The residues from Table 1 are shown as green (most negative ΔΔG’s) and red (most positive ΔΔG’s) are shown as van der Waals spheres at the Cα position of each residue.
Residues with Largest pKa Downshifts
As we illustrated in Figure 7 most of the residues that have large pKa downshifts are located at the periphery of the hexamer. It is known that HK97 assembles as capsomers (hexamers and pentamers)53 and therefore we might expect that disruption of interactions formed by these residues could have deleterious effects on the assembly process. Indeed this is true for several of the residues we have identified. ASP231 is involved in an intercapsomer salt bridge with LYS178 in the P-II state, as shown in Figure 8, and the single mutation D231L prevents assembly of procapsids.54 This interaction is broken in the mature state, but our pathway indicates the interaction is loosely maintained through the EI state. By examining the salt bridge distance between ASP231 on the A protein (hexamer) and K178 on the G protein (pentamer), we see the separation gradually increases until beyond the EI state (radius ≈ 255 Å) when the separation moves beyond 10 Å.
Figure 8.
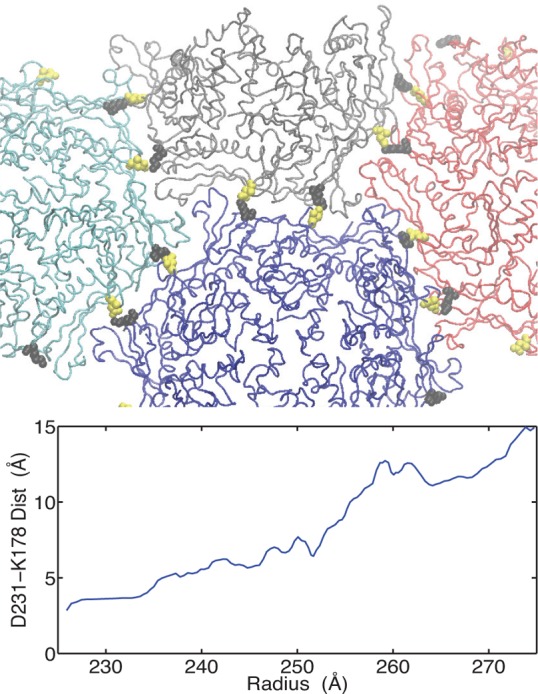
Intercapsomer interactions involving D231. On top, parts of four capsomers are shown for the P-II structure, the three hexamers (blue, red, cyan) are surrounding a pentamer (gray). The salt-bridging residues D231 and K178 are shown in yellow and black, respectively. In the graph below, the O–N distance between D231 and K178 for the interaction spanning the hexamer/pentamer interface in the asymmetric unit is plotted for our low energy pathway. Structural averaging was performed using a 5-point moving average.
Another critical set of interactions that are important for capsid assembly and structural stability are those interactions known as the three-fold “staple”. The staple consists of intercapsomer interactions around three-fold and quasi -three-fold axes, involving two sets of salt-bridging residues (GLU344-ARG347, GLU363-ARG194), with the orientation shown in Figure 9 in the P-II state. These interactions are believed to remain fixed through maturation and serve as an anchor point for other structural rearrangements to pivot about.13,21 Furthermore, mutation of either of the ARG residues or the double mutant E344A/E363A prevent formation of capsids. Our prediction that both E344 and E363 have lower pKa’s in the EI state, compared to P-II, is consistent with the capsid requiring these interactions to be maintained.
Figure 9.
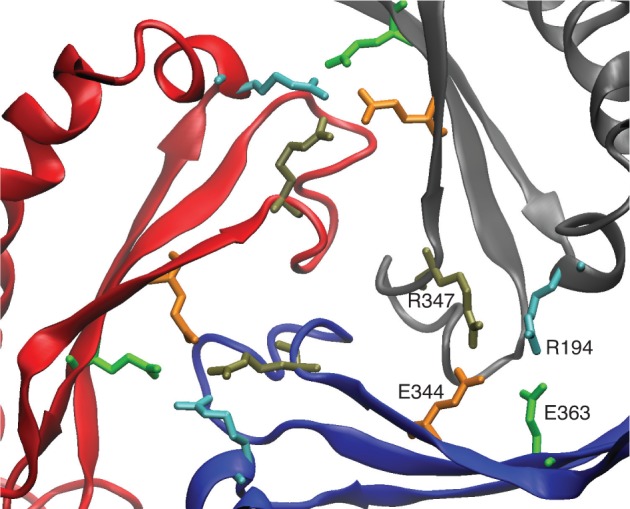
Interactions at the three-fold axis. Three subunits at a three-fold axis are shown with the salt-bridging residues of the three-fold staple; coloring of residue side chains is consistent in the three subunits.
We can also explain the role of GLU267 in controlling the maturation process, which is another one of the residues we identified with a significant pKa downshift between the P-II and EI states. GLU267 forms intersubunit interactions, which are varied from subunit to subunit. The interaction partners of GLU267 are either LYS317 or ARG280. Some of their interactions are conserved through the pathway, while others form as maturation proceeds. The salt bridge distances for six of the interactions are shown in Figure 10, and it can be seen that several of the interactions are conserved throughout the path, while others are dynamic and form interactions in the later stages of the pathway. This behavior seems inconsistent with what was observed in the ASP231 interactions, where the interaction was broken in the post EI state. However in both cases, we would argue that the negative ΔpKa is driven by the need to maintain the interaction up to the EI-state, and both GLU267 and ASP231 exhibit this character. On the other hand, the behavior of these interactions in the post EI state is driven by the relative pKa differences between the EI and the H-I, states and here we see the difference between ASP231 and GLU267. While the pKa’s are very similar for GLU267 and ASP231 in the P-II (5.21/5.22) and the EI (4.59/4.68) states, their pKa’s in the H-I state differ significantly. The pKa for ASP231 in the H-I state is 4.31, close to its value in the EI state. The pKa of GLU267 is significantly depressed in H-I to 3.53, which can be viewed as a driving force for the additional salt bridge interactions formed by GLU267 as it approaches the H-I state.
Figure 10.
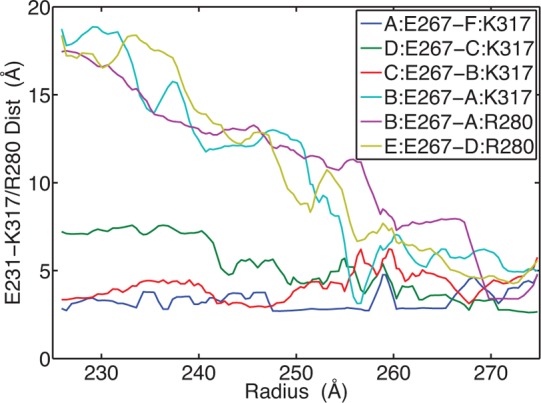
Salt bridge interactions involving GLU267. The legend indicates which subunits are partnering in the interaction by the letter before the colon (e.g., subunit:residue).
Residues with Largest pKa Upshifts
The residues which have significant upshifts in their pKa’s we propose are critical for mediating structural reorganization during maturation. These residues are likely to be involved in salt bridge interactions in the P-II state, but the change to a low pH causes them to become protonated and breaks the salt bridge, thus allowing for structural plasticity. In this section, we examine how the residues listed in Table 1, with pKa upshifts, mediate changes in three structural elements: (1) unkinking of the spine helix, (2) rotation of the E-loops, and (3) forming a symmetric environment at the six-fold axis (hexamer unskewing).
The P-II state has an interesting feature in its subunit topology. The long spine helix which runs through the P-domain of the subunit protein has a bent (kinked) conformation in the P-II state, Figure 1B. This was somewhat unexpected and it has been proposed that the straightening of the helix plays a significant role in the exothermic nature of the particle expansion.13,14 The spine helix interacts with the E-loop on a neighboring subunit, during maturation many interactions are disrupted between these motifs as the helix twists and straightens and the E-loop undergoes a significant rotation (more on the E-loop below). A salt bridge interaction between GLU153 on the E-loop and ARG210 on the helix is present in both the P-II and H-I/II states (Figure 11A), and is proposed to serve as a pivot point for guiding the E-loop into an orientation suitable for forming cross-links. However, our data indicates there is a transient nature to the GLU153-ARG210 interaction. We suggest that the interaction must be destabilized in order for the spine helix to have the flexibility to straighten. As shown in Figure 11B, the region of the pathway where GLU153-ARGR210 experience a significant separation (>5 Å), correlates with significant change in the helix kink angle. Therefore we can understand the large pKa upshift of GLU153 in the EI state as a driving force for protonating GLU153 under low pH conditions to allow for refolding of the spine helix to occur. The PEI state (∼240 Å) may gain thermodynamic stability under low pH conditions, because the helix can be free to unkink without the E153-R210 salt bridge to restrict its reorganization.
Figure 11.
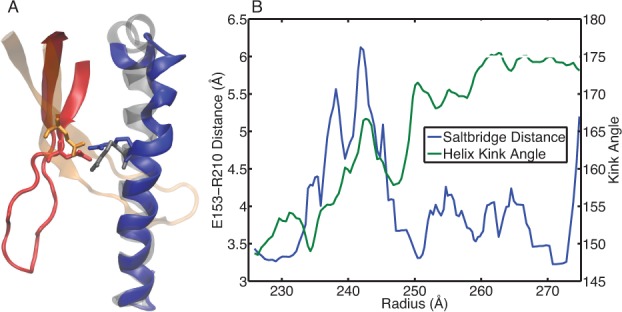
Spine helix bending. (A) The spine helix of the F-subunit is shown in the bent configuration from P-II (blue) and the straight configuration in H-I, also shown are the E-loops from the A-subunit (P-II in red, H-I in orange). The salt-bridging residues E153 on the E-loop and R210 on the helix are drawn as sticks. (B) The O–N distance between E153 and R210 for the interaction spanning subunits A and F is plotted along the left axis. The spine helix bending for the F subunit is plotted along the right axis. Structural averaging was performed on both the distance and bending data by computing a running average over five adjacent structures in the pathway.
The flexible E-loop region of the subunit protein is a dynamic element that plays a critical role in stabilization of the mature particle. In the wild-type particle isopeptide bonds form between residues LYS169, which is on the E-loop, and ASN356 on adjacent subunits. In the P-II state the E-loops have an upward pointing orientation (away from the capsid surface), then during maturation the loops rotate by 30° and lie down into the plane of the capsid.9,12,19 Owing to the dynamic nature of the E-loop, we observe three of our top five residues with pKa upshifts to be along the E-loop:GLU153, GLU149 and ASP173. We have observed a contact between GLU149 and GLN195 on neighboring subunits to be correlated with rotation of the E-loop. GLN195 is on a short helical segment close to the spine helix, where GLU149 is toward the base of the E-loop, Figure 12A. A hydrogen-bonding interaction between GLU149 and GLN195 is possible, but that interaction is likely to be disrupted upon protonation of GLU149. The separation of GLU149 and GLN195 allows for the E-loop to rotate and also for the spine helix to move away from the E-loop and accommodate the E-loop in the down position. The residue separation between GLU149 and GLN195 and the E-loop rotation are shown in Figure 12B and there is strong correlation between the two motions.
Figure 12.
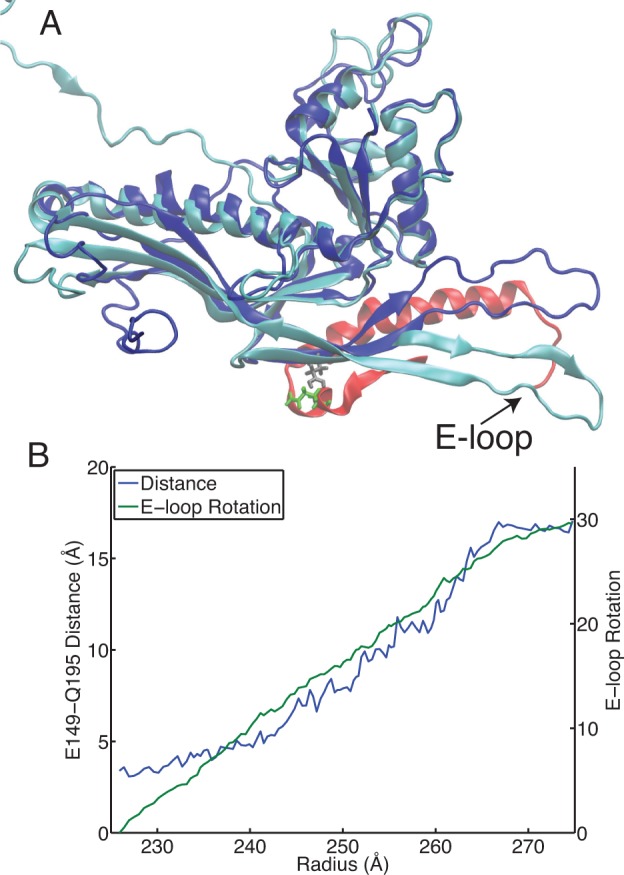
E-loop rotation. (A) The D-subunit is shown for the initial (blue) and final (cyan) conformations from the pathway. The structures were aligned using residues 200–300 in the D subunit. Also shown in red is a portion of the C subunit from the initial state. The residues E149 (gray) on the D-subunit and Q195 (green) on the C-subunit are shown. (B) The E-loop rotation and the minimum distance between E149 and Q195 on adjacent subunits are shown. Both the E-loop rotation and E-149-Q195 distances are averaged over the six hexamer subunits.
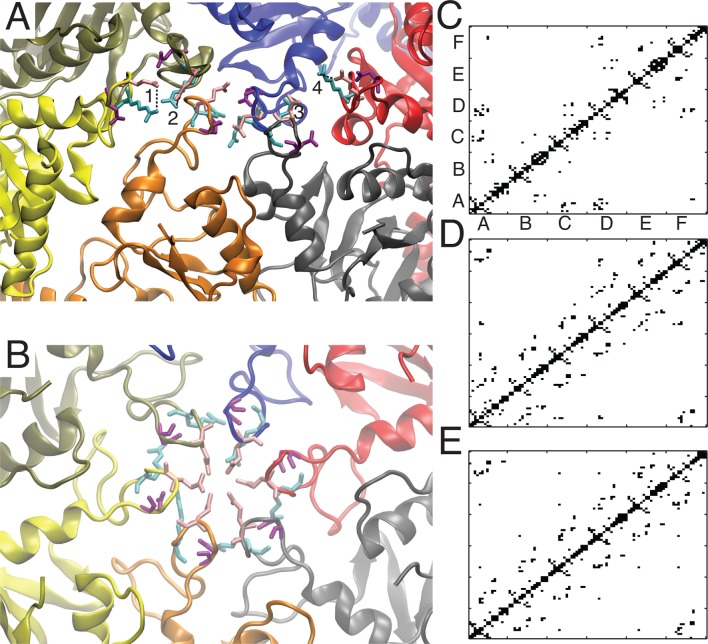
The residues GLU292 and ASP290 are located at the centers of the capsomers, and these residues appear to be mediating the dynamics of organization of the A-loops at the six-fold vertices. The dynamics at the six-fold axis could also be related to another, more global structural feature, which is the symmetry of the hexamer. In the prohead state the hexamers adopt an asymmetric, skewed configuration,13,15 and as the maturation process proceeds the hexamers “unskew” and adopt a six-fold symmetric configuration in the EI and H-I/II states. It has been proposed that the relief of the elastic shear stress in the skewed state is a driving force for maturation.55 Concomitant with the overall hexamer unskewing is the rearrangement of the A-loops from a linear, Figure 13A, to a circular/symmetric state, Figure 13B, at the 6-fold axis. In the P-II state, GLU292-ARG294 intrasubunit salt bridges are observed in four of the subunits (B,C,E,F). The A and D subunits are the central subunits in the linear orientation of A-loops in the P-II state, and the GLU292-ARG294 interaction is not observed in these subunits. However, the energy minimized initial state of the pathway displays intersubunit interactions between ASP290-ARG294 between the A and D subunits. Therefore we propose the abrogation of GLU292-ARG294 and ASP290-ARG294 interactions to be critical for allowing reorientation of the A-loops and obtaining a symmetric hexamer in the EI and H-I/II states. H/2H exchange has shown that the A-loops in EI and H-I are more protected than P-II and there is little change between the EI and H-I states.14 We have computed contact maps for structures in our pathway corresponding to the P-II (bead 0), EI (bead 76) and H-I (bead 119) states, shown in Figure 13 C–E, respectively. The A-loop contact maps of the structures in our pathway are consistent with the H/2H data, showing very similar maps between EI and H-I. Both the EI and H-I maps display more contacts between neighboring subunits, compared to P-II, and display A-F subunit contacts which are not present in P-II.
Figure 13.
A-loop orientations and contact maps. (A) The A-loop orientation from the P-II crystal structure (3E8K), the four salt bridges between E292-R294 are numbered. D290 residues are colored purple, E292 residues are colored pink, and R294 is cyan. The coloring of the subunits is as follows, A-blue, B-red, C-gray, D-orange, E-yellow, F-olive. (B) The A-loop orientation in the H-I crystal structure (2FS3), same coloring as in (A). (C–E) Contact maps for the structures from our energy minimized pathway. Contacts were computed by calculating the separation between the center of geometry of the side chains of residues 288–306. A contact was considered to be formed if the separation was less than 8 Å. The maps were computed for states representative of the P-II state (bead 0, shown in C), the EI state (bead 76, shown in D) and the H-I state (bead 119, shown in E).
Influence of DNA Packaging on Maturation
This study is focused on understanding the in vitro, pH-induced maturation pathway of HK97. However, it is tantalizing to try to relate these thermodynamic calculations to the in vivo process, which is driven by DNA-packaging into the capsid shell. While it is well established that bacteriophage capsids are extraordinarily robust nanoshells24,56,57 and their packaging machinery is likely the most powerful motor in biology,58−62 we contend that the structural changes to the capsid proteins contain significant contributions from the response to the changing chemical environment and do not arise solely from mechanical stress. For phages, this view is supported by the fact the maturation-related conformational changes in HK97 can be generated in the absence of DNA, that increased divalent cation concentrations weaken the mechanical response to nanoindentation in DNA-filled phage λ,63 and that theoretical calculations which have predicted that electrostatic energies are dominant to DNA-bending energies in fully packaged phage capsids.64,65 We postulate that the large negative charge density that packaged DNA introduces into the capsid, will cause negatively charged residues to protonate to reduce the charge–charge repulsion. This effect mimics low pH by increasing the pKa’s of those residues. The degree to which the pKa’s are increased should be a function of the amount of genome packaged. Therefore, at the P-II state, when only a small fraction of the genome is packaged, we expect the effect to be considerably less than in the fully packaged mature H-I(I) state.
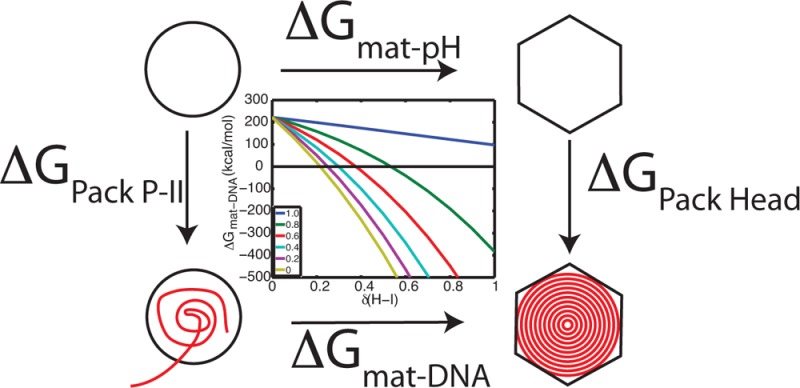
Given our assertion that DNA packaging will have a less significant effect on upshifting the acidic residue pKa’s in the P-II state compared to H-I(I), we can estimate how significantly DNA must perturb the pKa’s to make maturation favorable at physiological (neutral) pH. This calculation can be formulated by invoking a thermodynamic cycle, as described in Figure 14A. We know from our PMF calculation ΔGmat-pH = 206 kcal/mol at pH= 7.5, and we can calculate the electrostatic component of the free energy change in the capsid due to DNA packaging, as
| 6 |
where pKai* is the pKa of residue i in the presence of packaged DNA. We assume that the pKa’s in the presence of DNA are just a perturbation away from our calculated pKa’s, pKai* = pKai + δ. The DNA-induced maturation free energy is then
| 7 |
and we can calculate ΔGmat–DNA for varying ratios of the pKa perturbation, δ(P-II)/δ(H-I). This calculation is presented in Figure 14B. What is observed, is that relatively slight perturbations to H-I (<0.3 pKa units), are sufficient to make maturation favorable, when there is minimal perturbation to the pKa’s in P-II, which we expect to be the case. Furthermore, that at high perturbation ratios (0.8), maturation still becomes favorable around δ(H-I) = 0.6. These calculations have assumed that the perturbation is uniform to all residues, which is a naive assumption. It is more realistic to expect a distance-dependent effect; those residues close to the DNA will experience larger perturbations than those on the external surface; nonetheless, these calculations provide a back-of-the-envelope estimation, and serve to demonstrate a feasible connection between the in vitro and in vivo processes.
Figure 14.
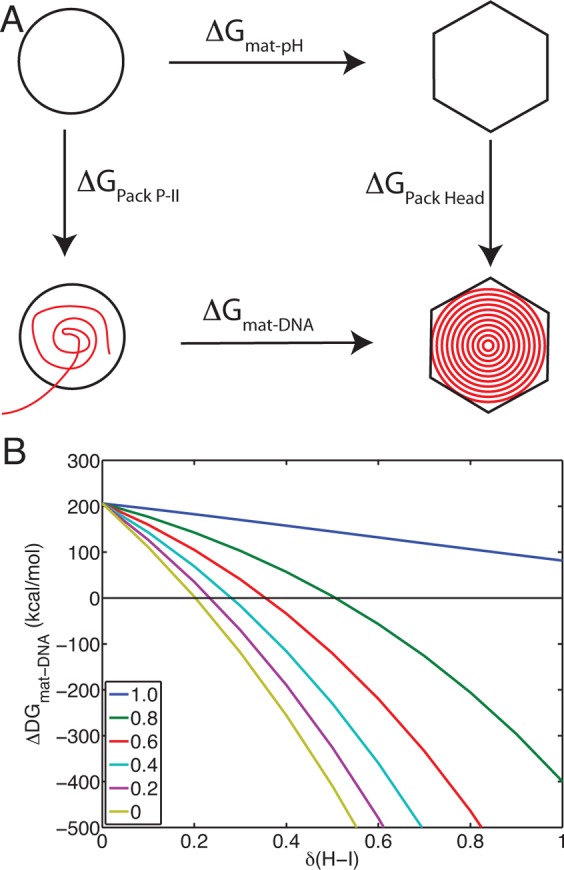
Effect of DNA packaging. (A) The free energy change of DNA-induced maturation can be related to the free energy change of pH-induced maturation through a thermodynamic cycle. (B) ΔGmat–DNA is plotted against the pKa perturbation (δ) to H-I. Each of the different colored trends represents a different ratio of the perturbation between P-II and H-I, δ(P-II)/δ(H-I), ranging from equal effect, ratio = 1.0 (blue line), to no effect on P-II, ratio = 0 (yellow line).
Conclusions
We have performed an extensive study investigating how local chemical perturbations are linked to massive global conformational changes in a virus capsid. We have computed the free energy landscape for the expansion and maturation of the HK97 capsid, which is in reasonably good agreement with known thermodynamic parameters for this process. By computing the pKa’s of titrating residues, we were able to demonstrate a pH-stability switch is occurring around the intermediate state, where expansion is favored at low pH in the initial stage of the pathway and then is favored at higher pH in the latter stage.
We have also examined those residues which display the largest pKa shifts between the initial and intermediate state. By examining the local environment of these residues and their relation to secondary structural elements in the subunit, we identified residues which have downshifted pKa’s as being critical for the capsid integrity. Conversely, those residues with significant pKa upshifts are related to dynamic elements in the capsid which undergo structural reorganization during maturation. Lastly, we considered how changes in the electrostatic environment caused by DNA packaging should be sufficient to drive conformational changes in the capsid.
The methods employed in this study combined constant pH MD with pathway refinement methods and free energy calculations, representing a coalescence of state-of-the-art techniques with extensive simulations. The agreement of our computations with experimental data from structural, H/2H, and thermodynamic sources indicates the robustness of our approach and its applicability to other pH-mediated viral processes. HK97 is a well-studied model system and provides a rich system to demonstrate our ability to predict which residues are “gate-keepers” for conformational changes. Furthermore, the methods and approach we have described have the potential to open new avenues for combating viral infections, as many viruses undergo a pH-dependent change during their life cycles.
Acknowledgments
This work has been supported by the National Science Foundation (MCB-1121575, DBI-0905773) and the National Institutes of Health (GM05713 and K22AI099163).
Supporting Information Available
This material is available free of charge via the Internet at http://pubs.acs.org.
The authors declare no competing financial interest.
Funding Statement
National Institutes of Health, United States
Supplementary Material
References
- Marsh M.; Helenius A. Cell 2006, 124, 729–740. [DOI] [PMC free article] [PubMed] [Google Scholar]
- Lakadamyali M.; Rust M. J.; Babcock H. P.; Zhuang X. Proc. Natl. Acad. Sci. U.S.A. 2003, 100, 9280–9285. [DOI] [PMC free article] [PubMed] [Google Scholar]
- Voss J. E.; Vaney M.-C.; Duquerroy S.; Vonrhein C.; Girard-Blanc C.; Crublet E.; Thompson A.; Bricogne G.; Rey F. A. Nature 2010, 468, 709–712. [DOI] [PubMed] [Google Scholar]
- Li L.; Jose J.; Xiang Y.; Kuhn R. J.; Rossmann M. G. Nature 2010, 468, 705–708. [DOI] [PMC free article] [PubMed] [Google Scholar]
- Moesker B.; Rodenhuis-Zybert I. A.; Meijerhof T.; Wilschut J.; Smit J. M. J. Gen. Virol. 2010, 91, 389–393. [DOI] [PubMed] [Google Scholar]
- Vázquez-Calvo Á.; Saiz J.-C.; McCullough K. C.; Sobrino F.; Martn-Acebes M. A. Virus Res. 2012, 167, 125–137. [DOI] [PubMed] [Google Scholar]
- Wikoff W. R.; Liljas L.; Duda R. L.; Tsuruta H.; Hendrix R. W.; Johnson J. E. Science 2000, 289, 2129–2133. [DOI] [PubMed] [Google Scholar]
- Lata R.; Conway J. F.; Cheng N.; Duda R. L.; Hendrix R. W.; Wikoff W. R.; Johnson J. E.; Tsuruta H.; Steven A. C. Cell 2000, 100, 253–263. [DOI] [PubMed] [Google Scholar]
- Conway J. F.; Wikoff W. R.; Cheng N.; Duda R. L.; Hendrix R. W.; Johnson J. E.; Steven A. C. Science 2001, 292, 744–748. [DOI] [PubMed] [Google Scholar]
- Gan L.; Speir J. A.; Conway J. F.; Lander G.; Cheng N.; Firek B. A.; Hendrix R. W.; Duda R. L.; Liljas L.; Johnson J. E. Structure 2006, 14, 1655–1665. [DOI] [PubMed] [Google Scholar]
- Ross P. D.; Conway J. F.; Cheng N.; Dierkes L.; Firek B. A.; Hendrix R. W.; Steven A. C.; Duda R. L. J. Mol. Biol. 2006, 364, 512–525. [DOI] [PMC free article] [PubMed] [Google Scholar]
- Lee K. K.; Gan L.; Tsuruta H.; Moyer C.; Conway J. F.; Duda R. L.; Hendrix R. W.; Steven A. C.; Johnson J. E. Structure 2008, 16, 1491–1502. [DOI] [PMC free article] [PubMed] [Google Scholar]
- Gertsman I.; Gan L.; Guttman M.; Lee K.; Speir J. A.; Duda R. L.; Hendrix R. W.; Komives E. A.; Johnson J. E. Nature 2009, 458, 646–650. [DOI] [PMC free article] [PubMed] [Google Scholar]
- Gertsman I.; Komives E. A.; Johnson J. E. J. Mol. Biol. 2010, 397, 560–574. [DOI] [PMC free article] [PubMed] [Google Scholar]
- Huang R. K.; Khayat R.; Lee K. K.; Gertsman I.; Duda R. L.; Hendrix R. W.; Johnson J. E. J. Mol. Biol. 2011, 408, 541–554. [DOI] [PMC free article] [PubMed] [Google Scholar]
- Lee K. K.; Gan L.; Tsuruta H.; Hendrix R. W.; Duda R. L.; Johnson J. E. J. Mol. Biol. 2004, 340, 419–433. [DOI] [PubMed] [Google Scholar]
- Helgstrand C.; Wikoff W. R.; Duda R. L.; Hendrix R. W.; Johnson J. E.; Liljas L. J. Mol. Biol. 2003, 334, 885–899. [DOI] [PubMed] [Google Scholar]
- Gan L.; Conway J. F.; Firek B. A.; Cheng N.; Hendrix R. W.; Steven A. C.; Johnson J. E.; Duda R. L. Mol. Cell 2004, 14, 559–569. [DOI] [PubMed] [Google Scholar]
- Ross P. D.; Cheng N.; Conway J. F.; Firek B. A.; Hendrix R. W.; Duda R. L.; Steven A. C. EMBO J. 2005, 24, 1352–1363. [DOI] [PMC free article] [PubMed] [Google Scholar]
- Caspar D. L.; Klug A. Cold Spring Harbor Symp. Quant. Biol. 1962, 27, 1–24. [DOI] [PubMed] [Google Scholar]
- Gertsman I.; Fu C.-Y.; Huang R.; Komives E. A.; Johnson J. E. Mol. Cell Proteomics 2010, 9, 1752–1763. [DOI] [PMC free article] [PubMed] [Google Scholar]
- Duda R. L.; Hempel J.; Michel H.; Shabanowitz J.; Hunt D.; Hendrix R. W. J. Mol. Biol. 1995, 247, 618–635. [DOI] [PubMed] [Google Scholar]
- Lee K. K.; Tsuruta H.; Hendrix R. W.; Duda R. L.; Johnson J. E. J. Mol. Biol. 2005, 352, 723–735. [DOI] [PubMed] [Google Scholar]
- Roos W. H.; Gertsman I.; May E. R.; Brooks C. L. III; Johnson J. E.; Wuite G. J. L. Proc. Natl. Acad. Sci. U.S.A. 2012, 109, 2342–2347. [DOI] [PMC free article] [PubMed] [Google Scholar]
- Rader A. J.; Vlad D. H.; Bahar I. Structure 2005, 13, 413–421. [DOI] [PubMed] [Google Scholar]
- Tama F.; Brooks C. L. III. J. Mol. Biol. 2005, 345, 299–314. [DOI] [PubMed] [Google Scholar]
- Kim M. K.; Jernigan R. L.; Chirikjian G. S. J. Struct. Biol. 2003, 143, 107–117. [DOI] [PubMed] [Google Scholar]
- May E. R.; Brooks C. L. III. J. Phys. Chem. B 2012, 116, 8604–8609. [DOI] [PMC free article] [PubMed] [Google Scholar]
- May E. R.; Feng J.; Brooks C. L. III. Biophys. J. 2011, 102, 606–612. [DOI] [PMC free article] [PubMed] [Google Scholar]
- Khandogin J.; Brooks C. L. Biophys. J. 2005, 89, 141–157. [DOI] [PMC free article] [PubMed] [Google Scholar]
- Lee M. S.; Salsbury F. R. Jr.; Brooks C. L. III. Proteins 2004, 56, 738–752. [DOI] [PubMed] [Google Scholar]
- Feig M.; Karanicolas J.; Brooks C. L. III. J. Mol. Graphics Modell. 2004, 22, 377–395. [DOI] [PubMed] [Google Scholar]
- Brooks B. R.; Brooks C. L. III; MacKerell A. D. J; Nilsson L.; Petrella R. J.; Roux B.; Won Y.; Archontis G.; Bartels C.; Boresch S.; Caflish A.; Caves L.; Cui Q.; Dinner A. R.; Feig M.; Fischer S.; Gao J.; Hodoscek M.; Im W.; Kuczer K.; Lazaridis T.; Ma J.; Ovchinnikov V.; Paci E.; Pastor R. W.; Post C. B.; Pu J. Z.; Schaefer M.; Tidor R.; Venable R. M.; Woodcock H. L.; Wu X.; Yang W.; York D. M.; Karplus M. J. Comput. Chem. 2009, 30, 1545–1614. [DOI] [PMC free article] [PubMed] [Google Scholar]
- MacKerell A. D. Jr.; Feig M.; Brooks C. L. III. J. Comput. Chem. 2004, 25, 1400–1415. [DOI] [PubMed] [Google Scholar]
- MacKerell A. D. Jr.; Bashford D.; Bellott M.; Dunbrack R. L. Jr.; Evanseck J. D.; Field M. J.; Fischer S.; Gao J.; Guo H.; Ha S.; Joseph- McCarthy D.; Kuchnir L.; Kuczera K.; Lau F. T. K.; Mattos C.; Michnick S.; Ngo T.; Nguyen D. T.; Prodhom B.; Reiher W. E. III; Roux B.; Schlenkrich M.; Smith J. C.; Stote R.; Straub J.; Watanabe M.; Wiókiewicz-Kuczera J.; Yin D.; Karplus M. J. Phys. Chem. B 1998, 102, 3586–3616. [DOI] [PubMed] [Google Scholar]
- Çağin T.; Holder M.; Pettitt B. M. J. Comput. Chem. 1991, 12, 627–634. [Google Scholar]
- Noé F.; Ille F.; Smith J. C.; Fischer S. Proteins 2005, 59, 534–544. [DOI] [PubMed] [Google Scholar]
- Lee M. S.; Feig M.; Salsbury F. R.; Brooks C. L. III. J. Comput. Chem. 2003, 24, 1348–1356. [DOI] [PubMed] [Google Scholar]
- Lee M. S.; Salsbury F. R.; Brooks C. L. III. J. Chem. Phys. 2002, 116, 10606. [Google Scholar]
- E W.; Ren W.; Vanden-Eijnden E. Phys. Rev. B 2002, 66, 052301. [Google Scholar]
- Khavrutskii I. V.; McCammon J. A. J. Chem. Phys. 2007, 127, 124901. [DOI] [PubMed] [Google Scholar]
- Khavrutskii I. V.; Arora K.; Brooks C. L. III. J. Chem. Phys. 2006, 125, 174108. [DOI] [PubMed] [Google Scholar]
- Im W.; Lee M. S.; Brooks C. L. III. J. Comput. Chem. 2003, 24, 1691–1702. [DOI] [PubMed] [Google Scholar]
- Laricheva E. N.; Arora K.; Knight J. L.; Brooks C. L. J. Am. Chem. Soc. 2013, 135, 10906–10909. [DOI] [PMC free article] [PubMed] [Google Scholar]
- Kumar S.; Rosenberg J. M.; Bouzida D.; Swendsen R. H.; Kollman P. A. J. Comput. Chem. 1992, 13, 1011–1021. [Google Scholar]
- Roux B. Comput. Phys. Commun. 1995, 91, 275–282. [Google Scholar]
- Knight J. L.; Brooks C. L. III. J. Comput. Chem. 2009, 30, 1692–1700. [DOI] [PMC free article] [PubMed] [Google Scholar]
- Shen J. K. J. Am. Chem. Soc. 2010, 132, 7258–7259. [DOI] [PubMed] [Google Scholar]
- Wriggers W. Biophys. Rev. 2010, 2, 21–27. [DOI] [PMC free article] [PubMed] [Google Scholar]
- Trabuco L. G.; Villa E.; Schreiner E.; Harrison C. B.; Schulten K. Methods 2009, 49, 174–180. [DOI] [PMC free article] [PubMed] [Google Scholar]
- Wyman J. Jr Adv. Protein Chem 1964, 19, 223–286. [DOI] [PubMed] [Google Scholar]
- Tanford C. Adv. Protein Chem. 1970, 24, 1–95. [PubMed] [Google Scholar]
- Xie Z.; Hendrix R. W. J. Mol. Biol. 1995, 253, 74–85. [DOI] [PubMed] [Google Scholar]
- Tso D. Ph.D. thesis, University of Pittsburgh, 2010. [Google Scholar]
- Aggarwal A.; Rudnick J.; Bruinsma R. F.; Klug W. S. Phys. Rev. Lett. 2012, 109, 148102. [DOI] [PubMed] [Google Scholar]
- Ivanovska I.; de Pablo P.; Ibarra B.; Sgalari G.; MacKintosh F.; Carrascosa J.; Schmidt C.; Wuite G. Proc. Natl. Acad. Sci. U.S.A. 2004, 101, 7600–7605. [DOI] [PMC free article] [PubMed] [Google Scholar]
- Ivanovska I.; Wuite G.; Jönsson B.; Evilevitch A. Proc. Natl. Acad. Sci. U.S.A. 2007, 104, 9603–9608. [DOI] [PMC free article] [PubMed] [Google Scholar]
- Rickgauer J. P.; Fuller D. N.; Grimes S.; Jardine P. J.; Anderson D. L.; Smith D. E. Biophysj 2008, 94, 159–167. [DOI] [PMC free article] [PubMed] [Google Scholar]
- Fuller D. N.; Raymer D. M.; Rickgauer J. P.; Robertson R. M.; Catalano C. E.; Anderson D. L.; Grimes S.; Smith D. E. J. Mol. Biol. 2007, 373, 1113–1122. [DOI] [PMC free article] [PubMed] [Google Scholar]
- Fuller D. N.; Raymer D. M.; Kottadiel V. I.; Rao V. B.; Smith D. E. Proc. Natl. Acad. Sci. U.S.A. 2007, 104, 16868–16873. [DOI] [PMC free article] [PubMed] [Google Scholar]
- Chemla Y. R.; Aathavan K.; Michaelis J.; Grimes S.; Jardine P. J.; Anderson D. L.; Bustamante C. Cell 2005, 122, 683–692. [DOI] [PubMed] [Google Scholar]
- Smith D. E.; Tans S. J.; Smith S. B.; Grimes S.; Anderson D. L.; Bustamante C. Nature 2001, 413, 748–752. [DOI] [PubMed] [Google Scholar]
- Evilevitch A.; Roos W. H.; Ivanovska I. L.; Jeembaeva M.; Jönsson B.; Wuite G. J. L. J. Mol. Biol. 2011, 405, 18–23. [DOI] [PubMed] [Google Scholar]
- Šiber A.; Božič A. L.; Podgornik R. Phys. Chem. Chem. Phys. 2012, 14, 3746. [DOI] [PubMed] [Google Scholar]
- Johnson W. E.; Dragar M.; Parsegian V. A.; Podgornik R. Eur. Phys. J. E 2008, 26, 317–325. [DOI] [PMC free article] [PubMed] [Google Scholar]
Associated Data
This section collects any data citations, data availability statements, or supplementary materials included in this article.


