
Figure 11.
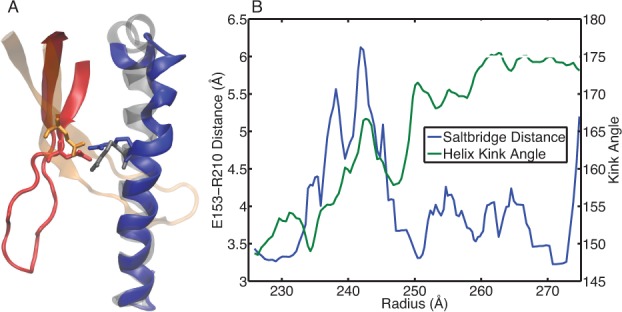
Spine helix bending. (A) The spine helix of the F-subunit is shown in the bent configuration from P-II (blue) and the straight configuration in H-I, also shown are the E-loops from the A-subunit (P-II in red, H-I in orange). The salt-bridging residues E153 on the E-loop and R210 on the helix are drawn as sticks. (B) The O–N distance between E153 and R210 for the interaction spanning subunits A and F is plotted along the left axis. The spine helix bending for the F subunit is plotted along the right axis. Structural averaging was performed on both the distance and bending data by computing a running average over five adjacent structures in the pathway.