
Figure 14.
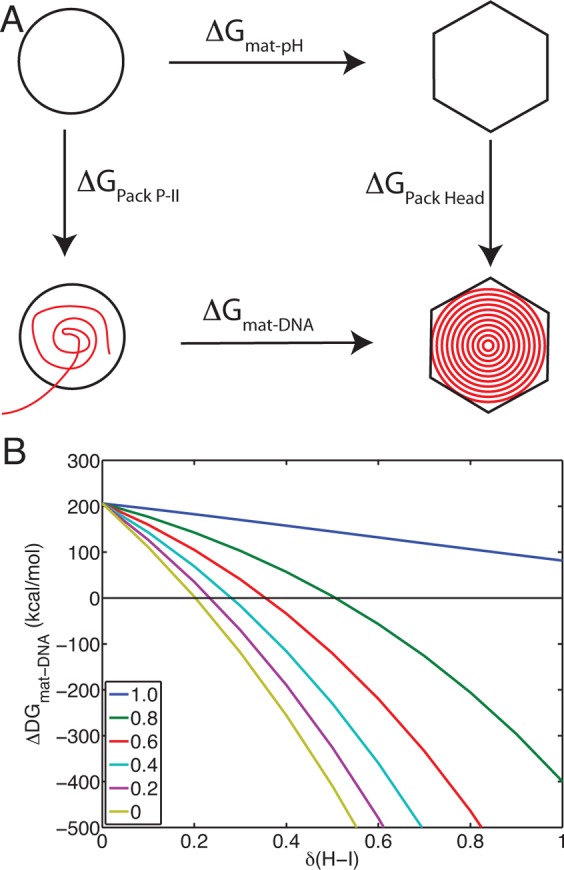
Effect of DNA packaging. (A) The free energy change of DNA-induced maturation can be related to the free energy change of pH-induced maturation through a thermodynamic cycle. (B) ΔGmat–DNA is plotted against the pKa perturbation (δ) to H-I. Each of the different colored trends represents a different ratio of the perturbation between P-II and H-I, δ(P-II)/δ(H-I), ranging from equal effect, ratio = 1.0 (blue line), to no effect on P-II, ratio = 0 (yellow line).