
Figure 1.
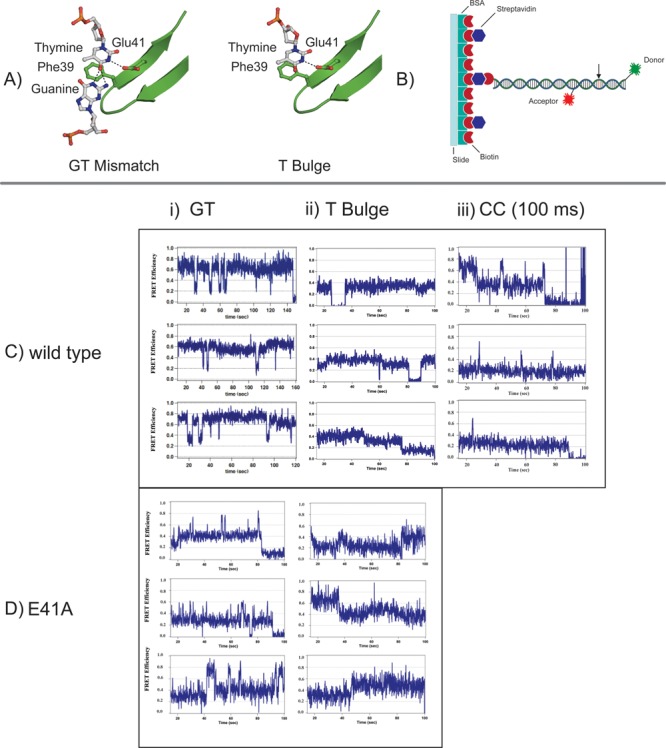
Representative single-molecule FRET traces for MutS and MutS-E41A bound to GT, T-bulge, and CC mismatch DNA. (A) Models illustrating the interactions between Phe39 and Glu41 of Taq MutS and a GT mismatch or a T-bulge. The Taq MutS–T-bulge structure is derived from Protein Data Bank entry 1EWQ.11 The Taq MutS–GT structure is a model derived from aligning the recognition motifs of E. coli MutS GT (Protein Data Bank entry 1E3M)10 with the Taq MutS–T-bulge structure (Protein Data Bank entry 1EWQ).11 Molecular models were created using PyMOL Molecular Graphics System, version 1.3 (Schrödinger, LLC). (B) Cartoon illustrating the 50 bp DNA substrate used in single-molecule FRET studies. DNA was immobilized via a biotin and streptavidin surface functionalization. A TAMRA or Cy3 donor dye is located at the 3′ end, and a Cy5 acceptor dye is located 19 bases from the donor. (C and D) Example smFRET traces for MutS and MutS-E41A, respectively, in the presence of (i) GT, (ii) T-bulge, and (iii) CC. Acceptor or donor blinking causes excursions to zero FRET in some traces. Each tick mark on the x-axis represents 20 seconds.