Figure 5.
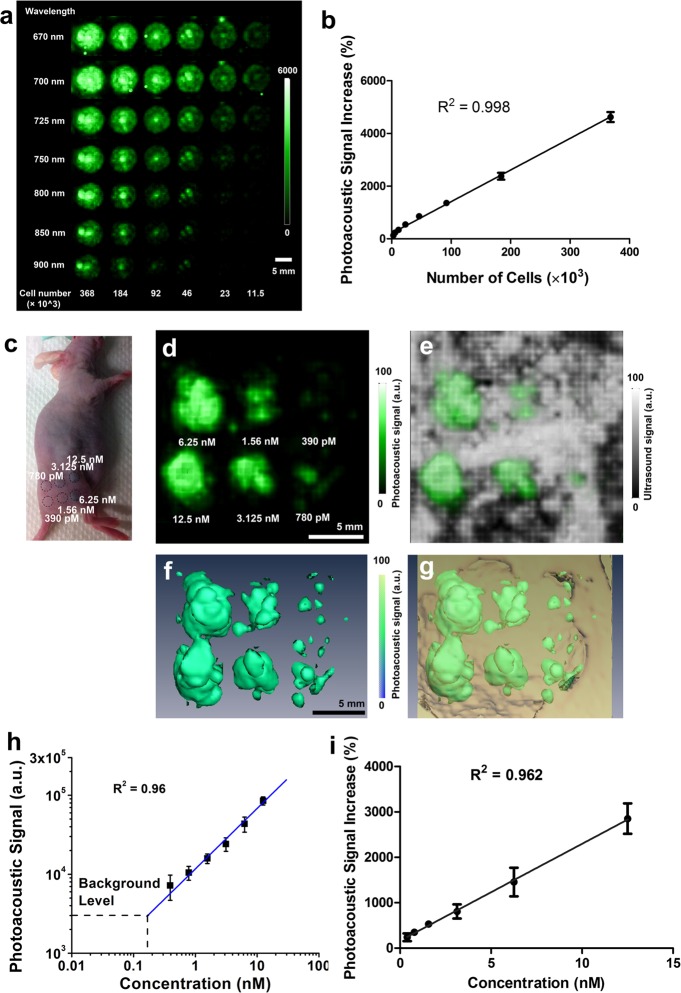
High sensitivity of Au-tripods for photoacoustic molecular imaging. (a) The top view of three-dimensional (3D) volume rendering of photoacoustic images of an agarose phantom containing decreasing number of U87MG cancer cells exposed to RGD-Au-tripod at different wavelengths (670, 700, 725, 750, 800, 850, 900 nm). The inhomogeneous signal inside wells is due to possible aggregation of cells. (b) Quantitative analysis of the photoacoustic signal (relative to the background signal) from the phantom (n = 3). (c) RGD-Au-tripod ranging in concentrations from 390 pM to 12.5 nM were injected subcutaneously into the flank of living mice (n = 3) and scanned with photoacoustic instrument. (d,e) Picomolar photoacoustic detection of tripods in living mice. The coronal view (d) of 3D volume rendering of photoacoustic images of subcutaneous inclusions. The skin is visualized in the ultrasound image (gray-scale images), which is overlaid with photoacoustic images (green-scale images). (f,g) Three-dimensional volume rendering of photoacoustic images (green) and ultrasound images (brown) of subcutaneous inclusion. a.u. = arbitrary units. (h) Photoacoustic signals recorded in vivo increased linearly with the tripod concentration (R2 = 0.96, n = 3 mice, data represent mean ± SD). The background level represents the endogenous signal measured from tissues. (i) Quantitative analysis of the photoacoustic signal (relative to the background signal) (mice n = 3).

