
Figure 1.
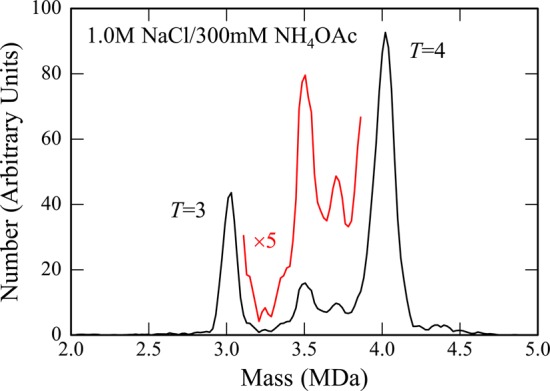
Mass spectrum measured by CDMS for HBV capsids assembled under aggressive conditions (1 M NaCl) and dialyzed into 300 mM NH4OAc. The mass spectrum is a histogram obtained by binning the measured masses for 5893 individual ions with 20 kDa bins. After binning, the histograms were smoothed with a five point Savitsky-Golay algorithm. The red line shows an expanded view of the region between the T = 3 and T = 4 peaks.