
Figure 3.
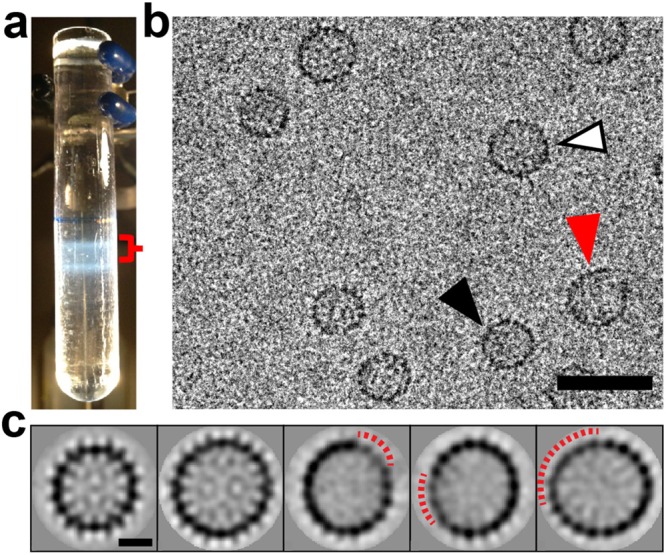
Characterization of the HBV capsids. (a) HBV capsids separated on a sucrose gradient showing the extracted fraction (red brace) used for cryo-EM analysis. (b) A representative cryo-EM micrograph of a frozen-hydrated HBV specimen. Black arrowhead, T = 3 capsid. White arrowhead, T = 4 capsid. Red arrowhead, capsid with defects. Scale bar, 50 nm. (c) Selected class averages show a T = 3 average, a T = 4 average, and three averages with defects, respectively. The red dashed lines indicate regions of weak density on the capsid. Scale bar = 10 nm. The averages in panel (c) correspond to classes 3, 7, 20, 8, and 1, respectively, in Figure S2 of SI.