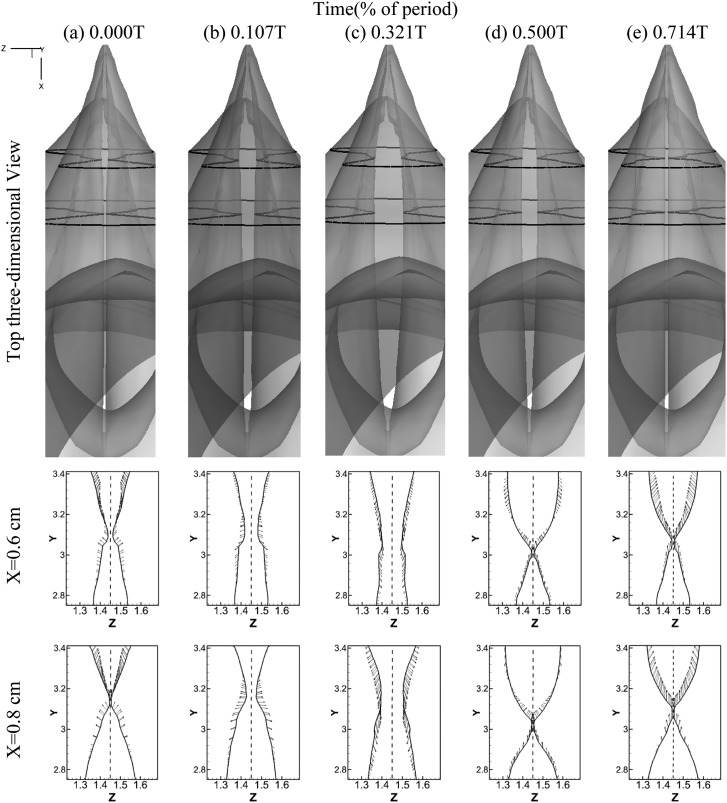
Figure 3.
Glottal configurations at 5 different time instants during one vibration cycle. The first raw shows the top 3D view of glottis. The configurations of glottis at two cross sections x = 0.6 cm and x = 0.8 cm, respectively, are shown in the second and third raw. The locations of these planes are indicated by the black lines superimposed on the 3D view.

