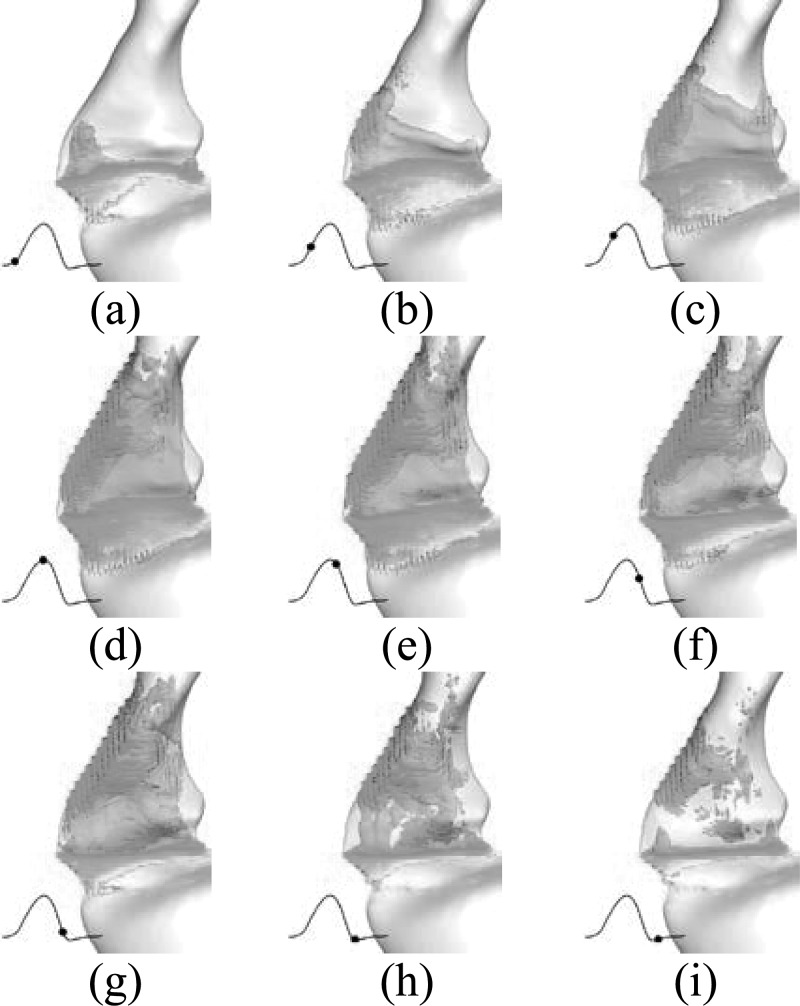
Figure 8.
(Color online) Time evolution of the vortical structure (shown by the iso-surface of total vorticity) during one vibration cycle. (a–i) Correspond to nine time-instants. The volume flow rate is superimposed at the left corner of each subfigure and the black dot indicates the corresponding time instant.

