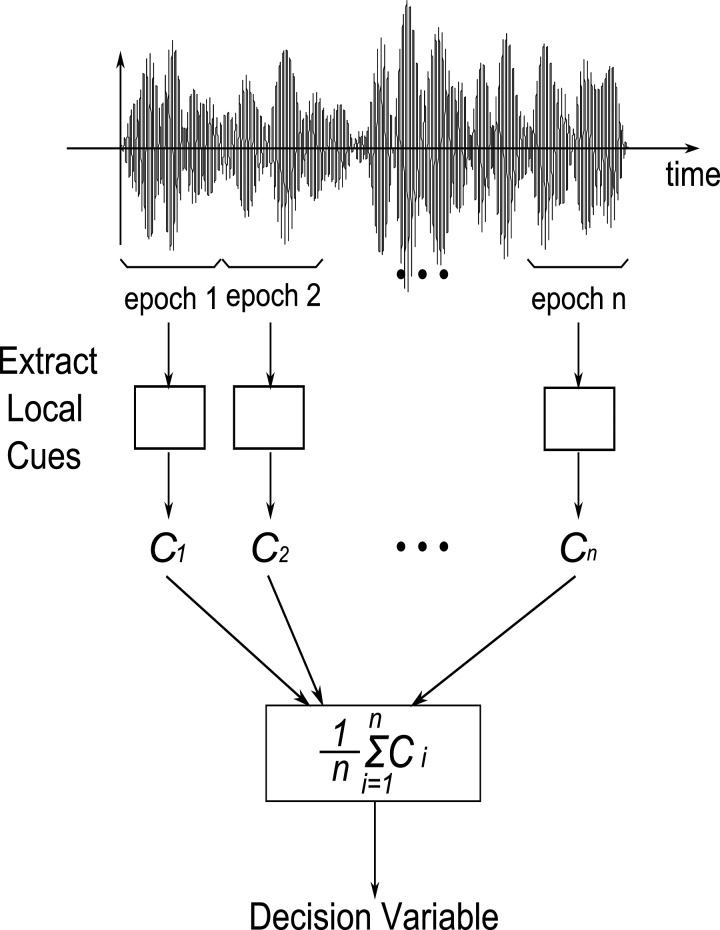
Figure 2.
A schematic diagram illustrates a DV that was computed by combining local cue information across epochs for a single cue (ILD, ITD, or SIED). The waveform was separated into several equal-duration epochs along the time axis, and the local cues (Ci) were obtained. The DV was the mean value of the cue across epochs.

